How high Solana can rally in December, and can SOL beat XRP?
- Solana started consolidating in the last week of November following a nearly three-week rally.
- SOL slipped 15% from its all-time high of $264.39, but derivatives traders remain bullish.
- Solana trade volume declined to average levels, though its price holds steady above the $215 support.
- SOL needs to add $30 billion in market capitalization to replace XRP as the second-largest altcoin.
Solana (SOL) is currently consolidating after hitting its all-time high at $264.39 on November 22. While SOL is consolidating, trade volume declined, however, total open interest remains above average levels.
Funding rates aggregated by Santiment show derivatives traders are bullish on SOL. The recent gain in Solana price fueled the narrative of SOL flipping Ripple (XRP) in market capitalization in the ongoing market cycle.
Solana price dips 15% from all-time highs
Solana is trading at $225.54 early on Monday. SOL is trading 15% below its all-time high from November 2024. While SOL consolidates, the altcoin sustains above support at $215.
On-chain metrics show a likelihood of recovery in Solana in the coming weeks. Since derivatives traders are bullish on SOL, it is likely that the altcoin recovers and ends the consolidation phase. In this case, SOL could attempt a retest of the all-time high, and a break past $264.39 could push Solana into price discovery.
The $300 level is a psychologically important price level for SOL.
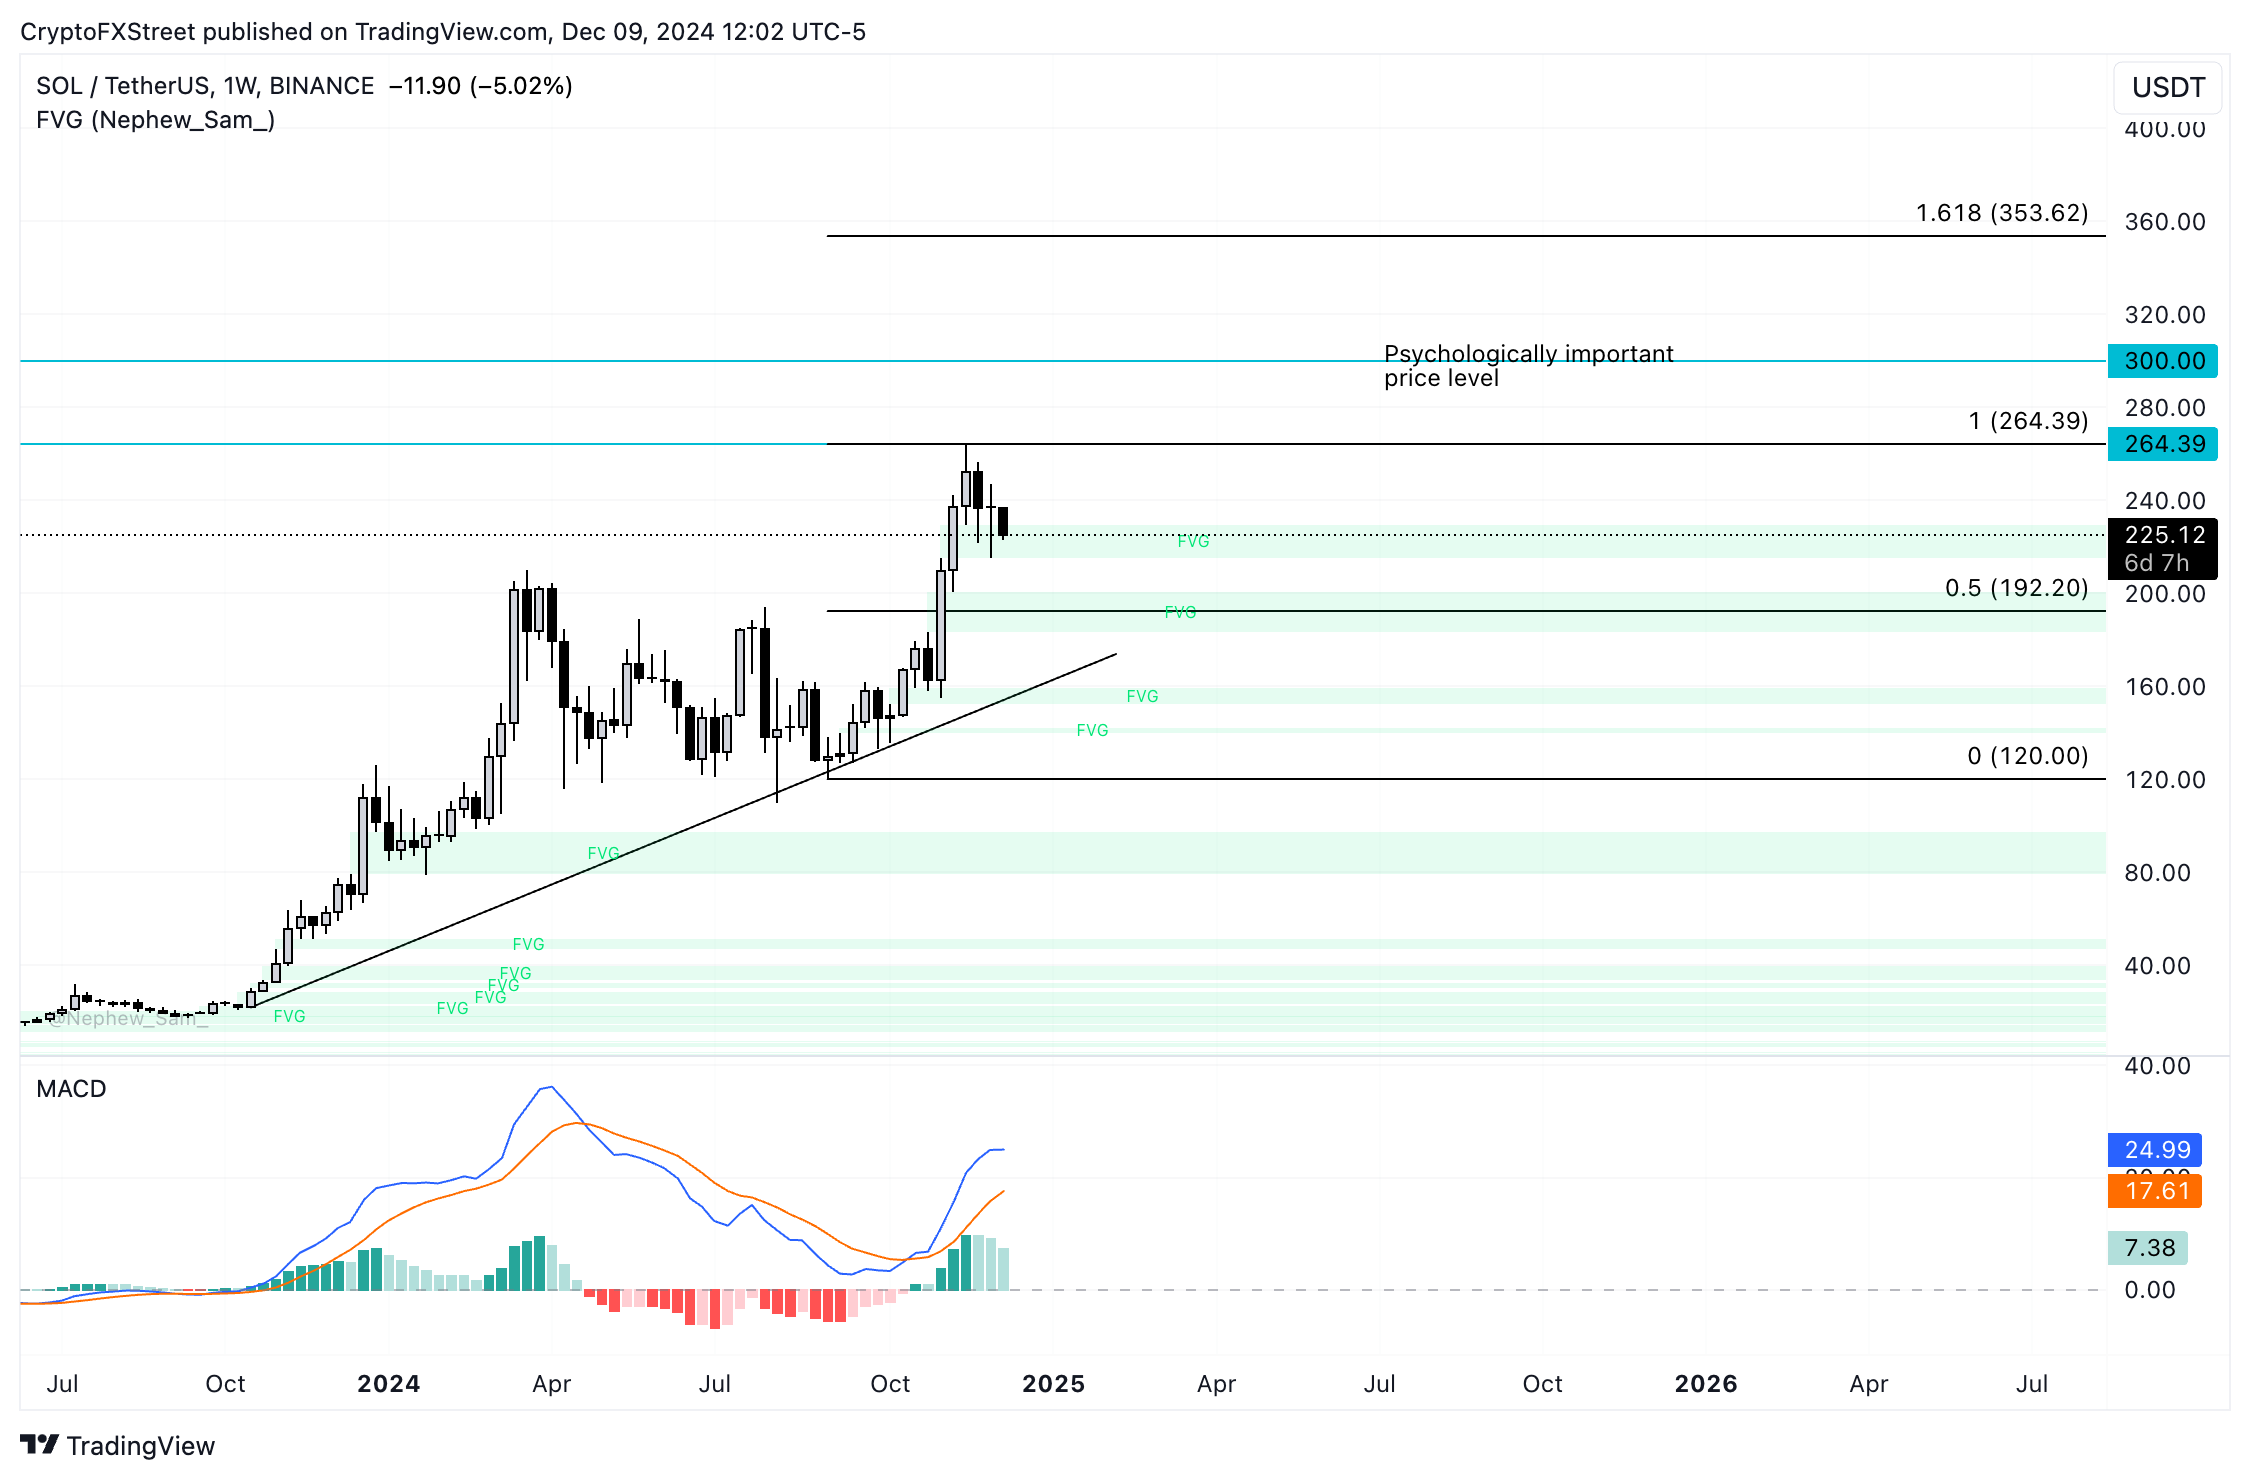
The SOL/USDT weekly price chart shows the likelihood of further gains in Solana. The altcoin could end the consolidation phase and resume its climb. The momentum indicator Moving Average Convergence Divergence (MACD) flashes green histogram bars above the neutral line, supporting thesis of gains in SOL.
Solana has an underlying positive momentum in its price trend on the weekly timeframe.
SOL could find support in the zone between $215.27 and $229.60, as seen in the chart below.

SOL/USDT weekly price chart
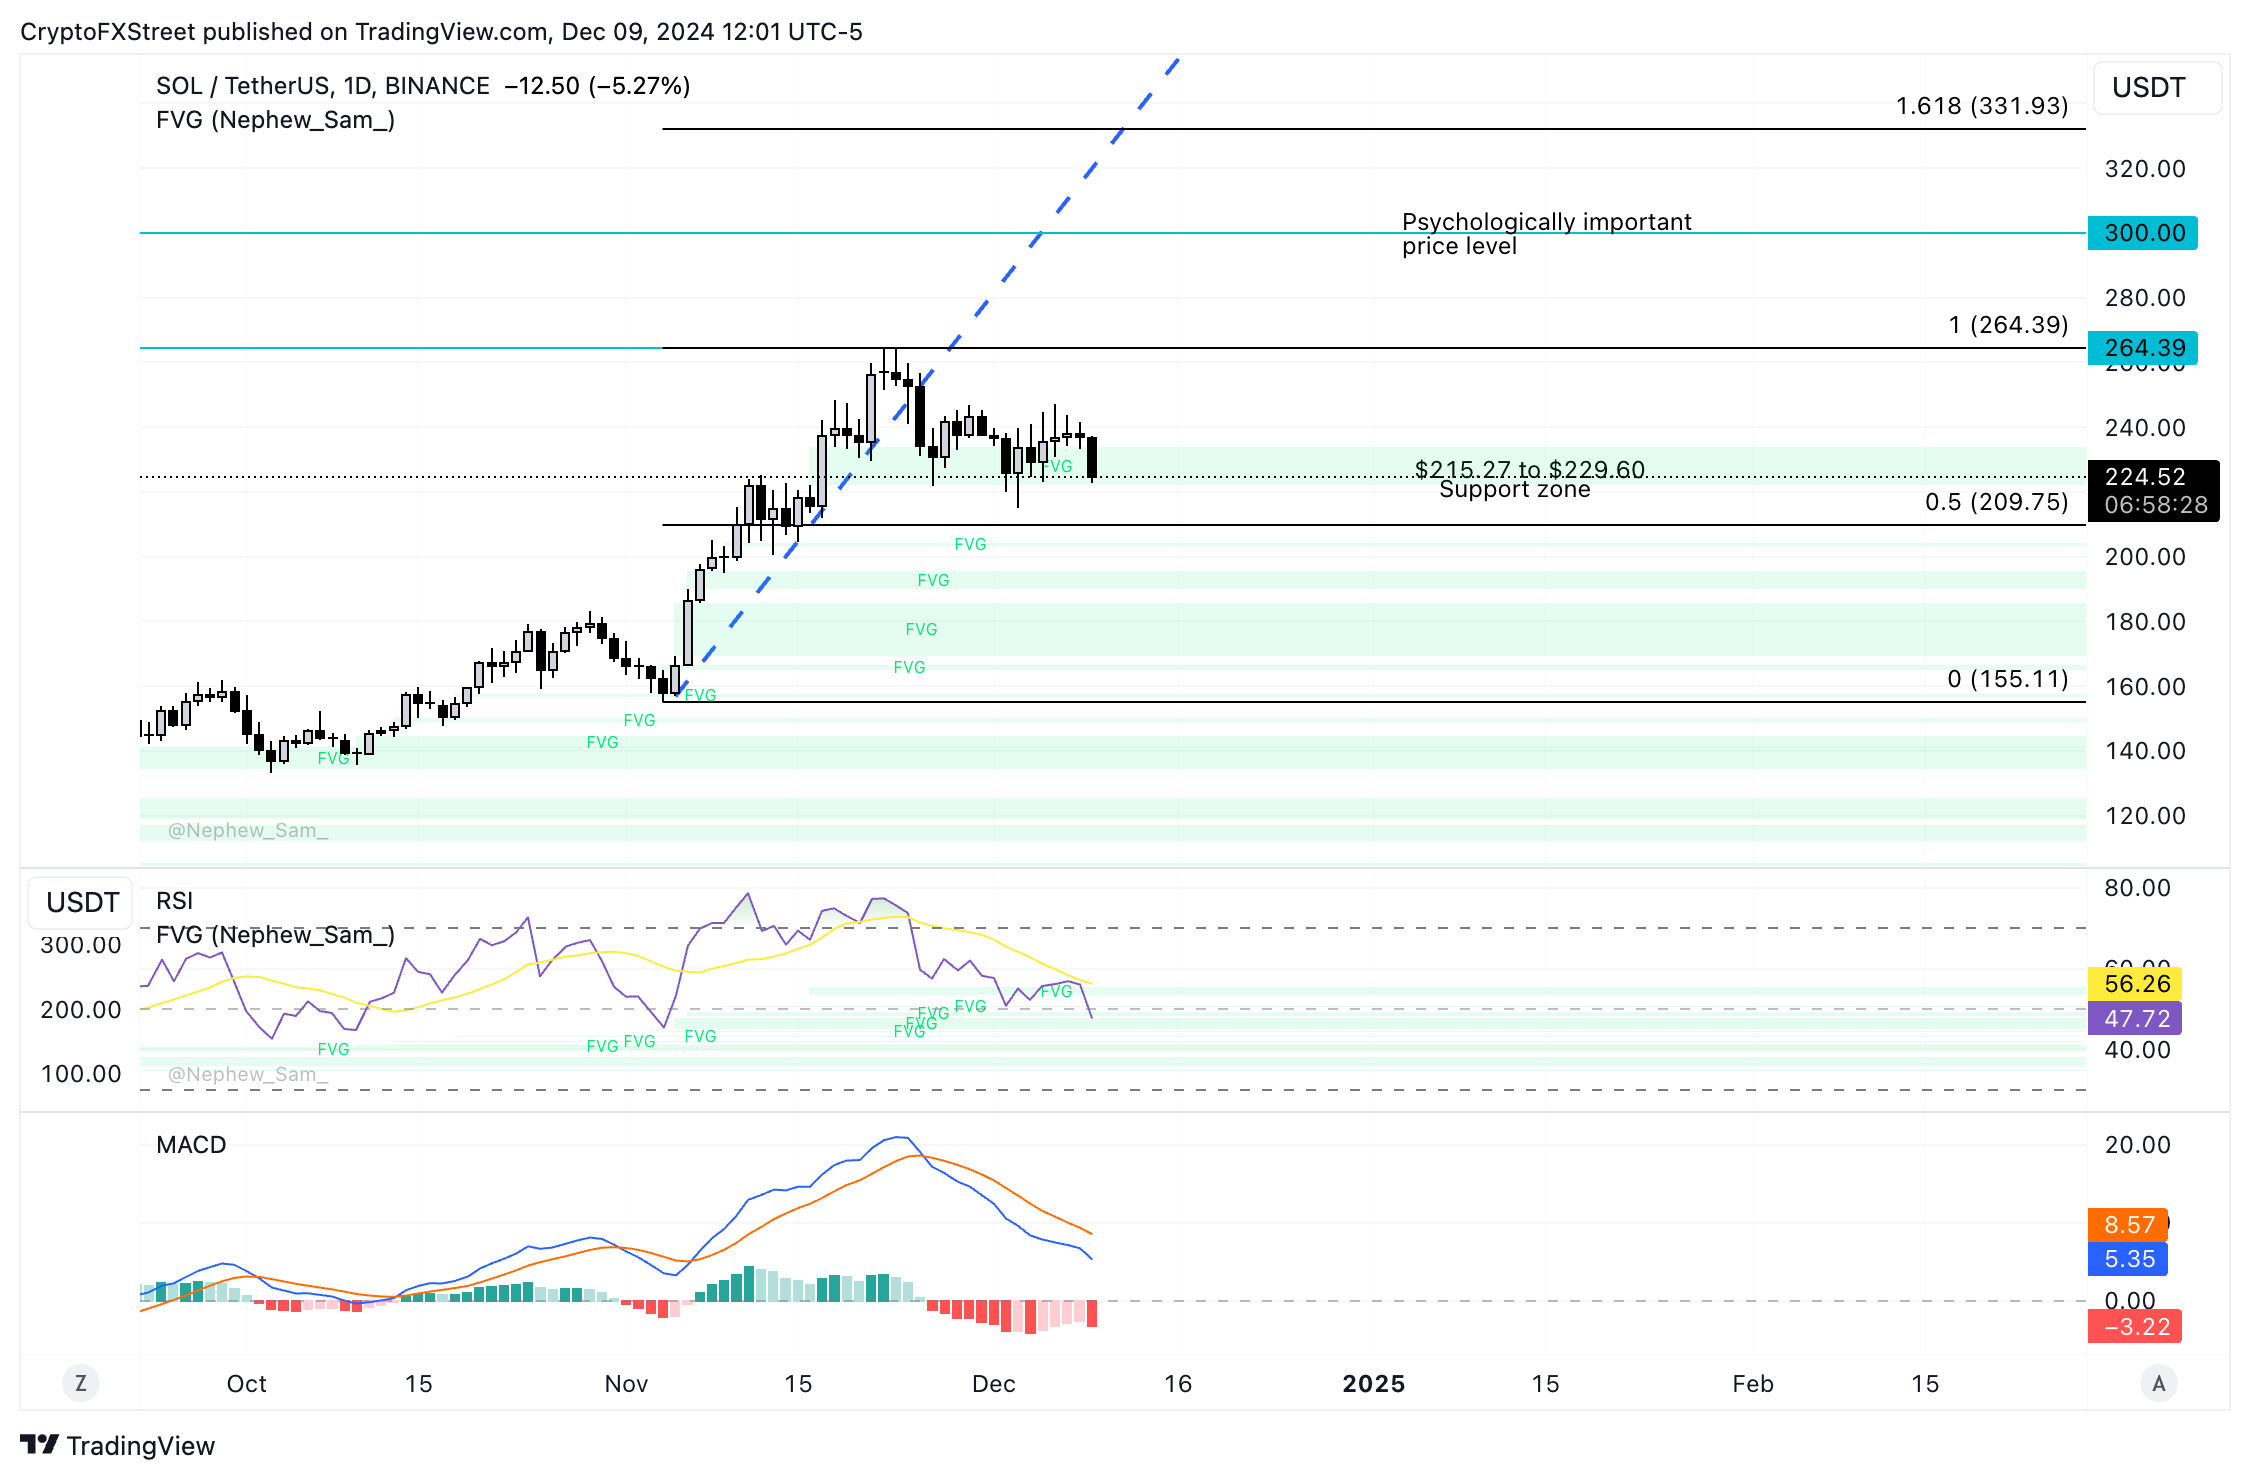
The daily price chart shows the consolidation could continue this week. Solana needs a daily candlestick close above $256, the November 25 peak, to break out of the sideways trend.
SOL is currently in the imbalance/support zone between $215.27 and $229.60. Once SOL ends its consolidation, the altcoin is set to target its all-time high and the psychologically important level of $300 this cycle.
A daily candlestick close above $300 could confirm a continuation of the rally and the $331.93 target comes into play. This coincides with the 161.8% Fibonacci retracement of the climb from the November 4 low of $155.11 to the all-time high of $264.39.
The Relative Strength Index (RSI) reads 47, under the neutral level at 50, and MACD shows an underlying negative momentum in the SOL price trend on the daily timeframe.
Traders need to watch the technical indicators closely for signs of reversal in the SOL price trend.

SOL/USDT daily price chart
Solana on-chain metrics support gains in SOL
Santiment data shows that the funding rate in Solana across derivatives exchanges remained positive throughout December 2024. Derivatives traders are bullish on Solana.
The total open interest in Solana climbed to a peak of $4.198 billion on November 7. Since then, even as price consolidates, open interest remains above average levels.
 [21.42.31, 09 Dec, 2024]-638693637883752147.png)
Total open interest and funding rates in Solana | Source: Santiment
Solana’s trade volume noted a significant decline. While price rallied to its November 2024 top, volume across crypto exchanges dropped down to average levels. This raises concerns of participation by retail traders.
 [21.42.36, 09 Dec, 2024]-638693638202067822.png)
Volume and price (SOL) | Source: Santiment
Solana eats Ethereum’s market share, competes with XRP
A market report by 21Shares published this week shows that throughout 2024 Solana captured a large volume of Ethereum’s (ETH) market share. Over $2 billion in cryptocurrencies were transferred directly from Ether to Solana, and SOL noted net inflows of $1.2 billion.
Analysts are quoted in the report:
While we don’t anticipate a full “flippening”, Solana is primed to outperform and capture more market share from Ethereum through improved UX and infrastructure.
Solana may not outperform Ethereum by market capitalization since the latter retains its network effect and first mover advantage in total volume of cryptocurrencies locked in its chain. Still, SOL is $30 billion away from flipping XRP in terms of market cap.
XRP is currently the second-largest altcoin after Ethereum. If Solana overtakes XRP, it could dethrone the altcoin to rank second to Ethereum, laying the foundation for a “flippening” in subsequent market cycles.


