BNB Price Forecast: Binance Coin hovers near all-time high as Binance reaps benefits from crypto rally
- BNB price hovers around $720 on Monday, down from an all-time high of $794 on December 4 and holding a market capitalization above $100 billion.
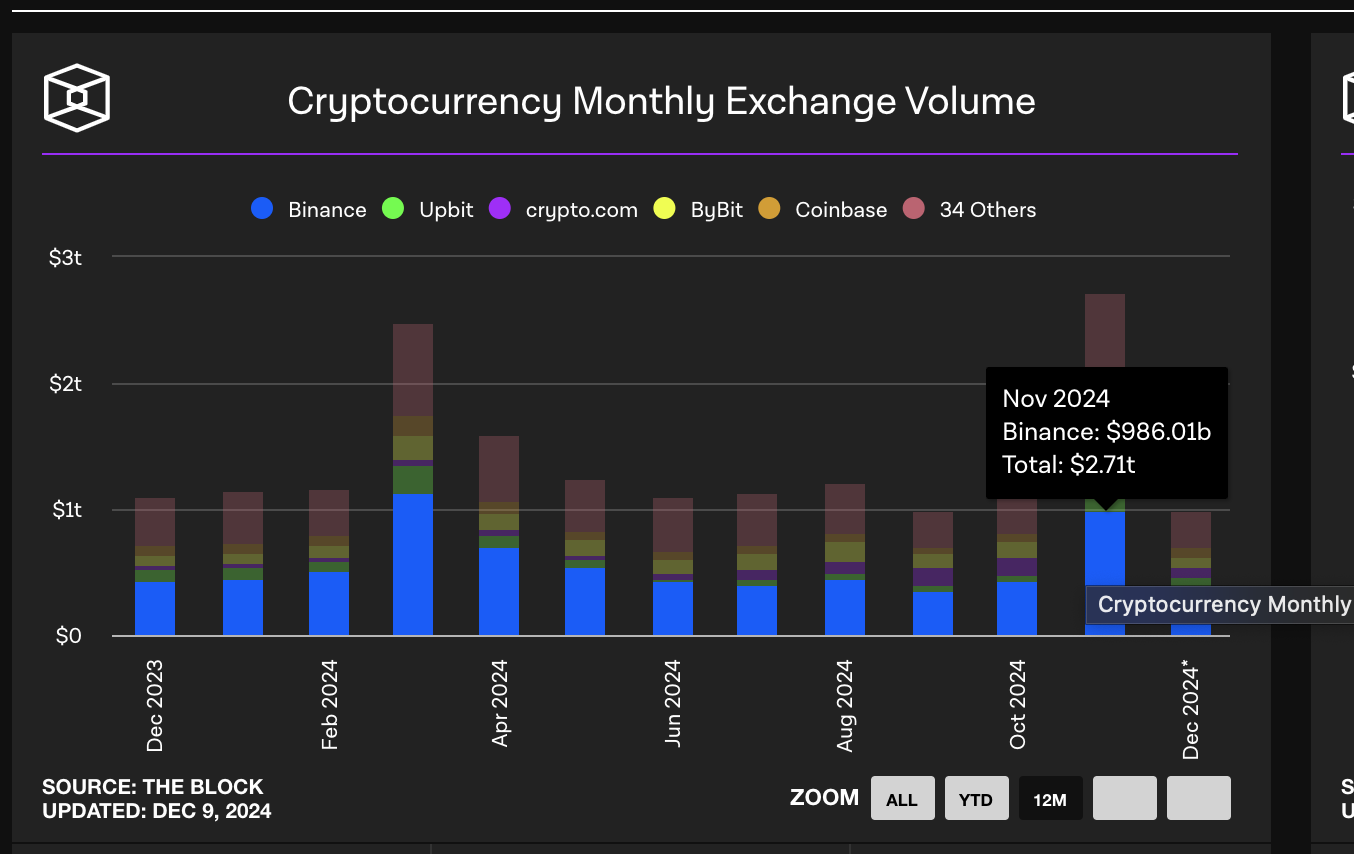
- Binance handled 36% of the global crypto market trading volume in November, or $986 billion, as the market rallied following Trump’s reelection.
- Binance has pulled another $350 billion in trading volumes in December so far, and BNB price volatility has increased sharply.
BNB consolidates around the $720 mark on Monday, after an all-time high rally to $794 on December 4 propelled its market capitalization above the $100 billion milestone. Market activity trends suggest BNB could be on the verge of another major breakout in the weeks ahead.
BNB price hits all-time high as Trump re-election sparks market frenzy
BNB, the native coin on Binance, the world's largest cryptocurrency exchange, has been on a steady price uptrend over the last 30 days.
The rally can be attributed to Donald Trump's re-election in the United States presidential election, along with crypto-friendly policy proposals and cabinet nominations, which have sparked a trading frenzy across global crypto markets.
 Cryptocurrency Exchange Monthly Trading Volume | Source: TheBlock
Buoyed by Trump’s re-election, the global crypto market trading volume hit $2.71 trillion in November, the highest monthly activity since 2021.
According to aggregate data culled from TheBlock, Binance captured 36% of the traction, with total trades worth $986 billion executed on the exchange last month.
Since its inception in July 2017, BNB price has been positively correlated to Binance exchange trading activity as users who hold the token obtain fee discounts of up to 25%.
Hence, spikes in exchange trading volume often trigger increased demand for BNB, consequently driving up prices.
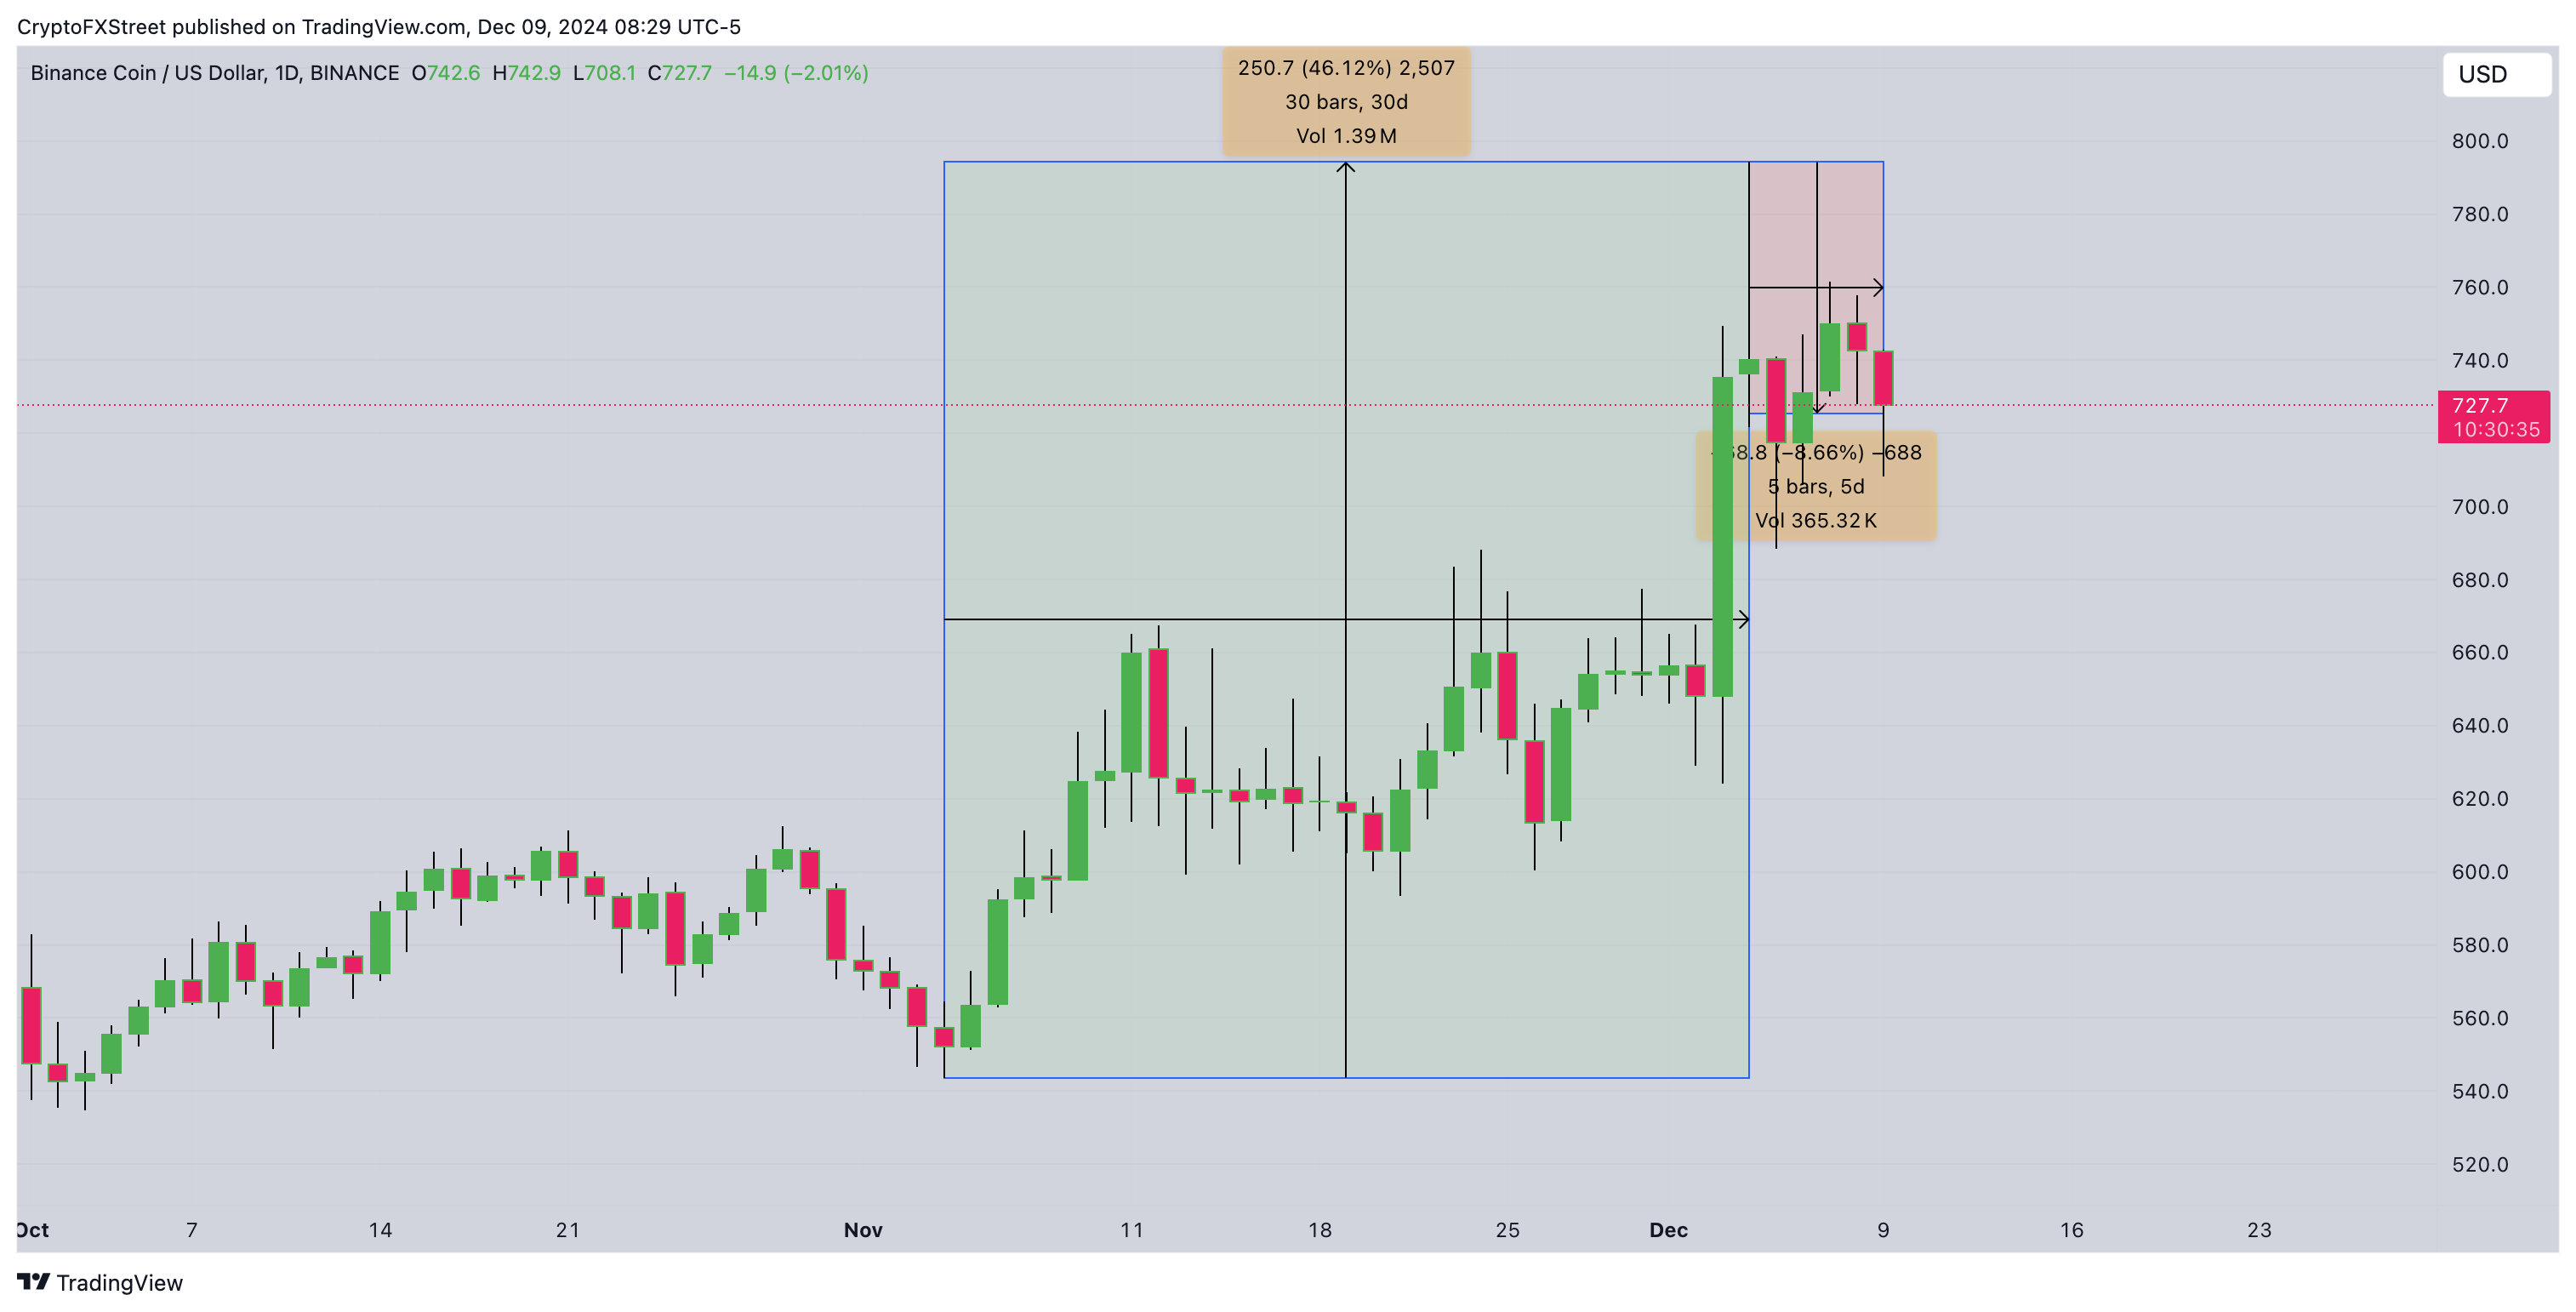
 BNB Price Action | BNBUSDT (Binance)
This bullish phenomenon has reared its head again over the past month as Trump’s victory on November 5 triggered a surge in demand for cryptocurrencies globally.
Validating this narrative, the chart above shows how BNB price rose 46% from $543 on November 4 to an all-time high of $794 on December 4, before retracing 8.6% towards the $720 level on Monday.
Spikes in BNB market volatility signals more upside ahead
After failing to breach the $800 resistance, BNB has corrected by 8.7% over the past five days. Despite this, Binance’s surging trading volumes and heightened price volatility signal the potential for another rally in the weeks ahead.
According to TheBlock, Binance has recorded $350 billion in trading volumes within the first nine days of December, putting it on track to surpass November’s milestone of $986 billion.
This increase in activity often correlates with heightened speculative interest, which could fuel rapid price swings.

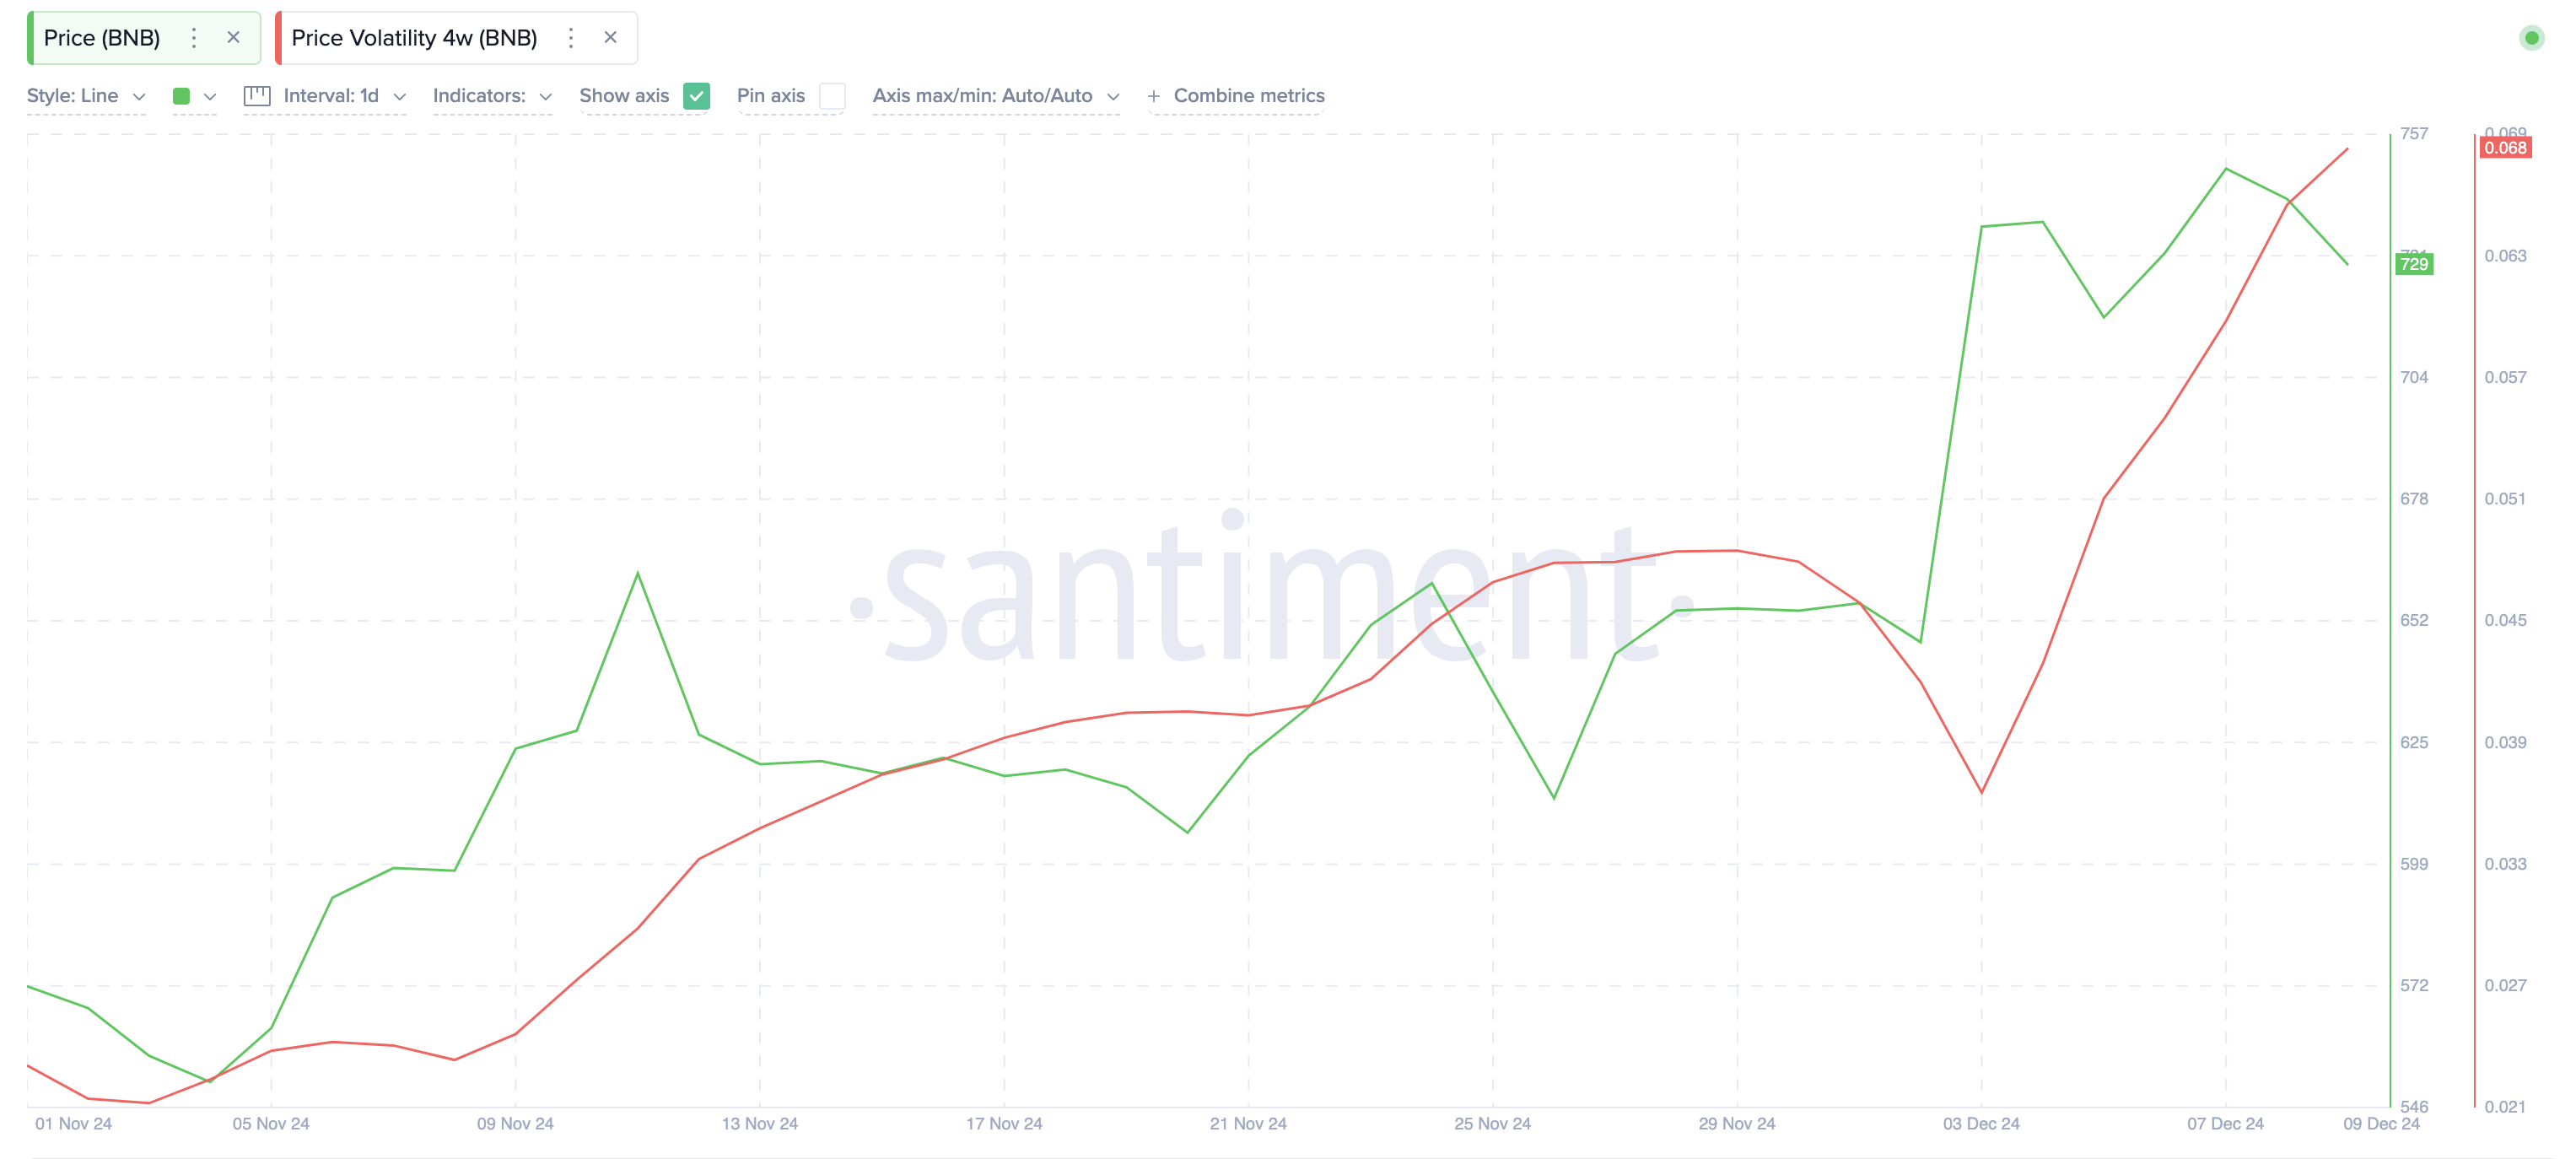
BNB Price Volatility (4w) | Source: Santiment
Santiment’s data on BNB price volatility over a 4-week period lends more credence to this bullish outlook.
As seen above, BNB’s 4-week volatility surged from 0.36 on December 3 to 0.67 by Monday, a sharp 89% increase.
Historically, rising volatility during a price correction often precedes significant price rebounds as market participants reposition their trades.
If volatility continues to climb alongside Binance’s trading volumes, BNB bulls could attempt another major price breakout in the coming weeks.
BNB price forecast: $800 breakout ahead if $675 support holds
BNB's price action reflects a bullish outlook supported by rising Binance trading volumes.
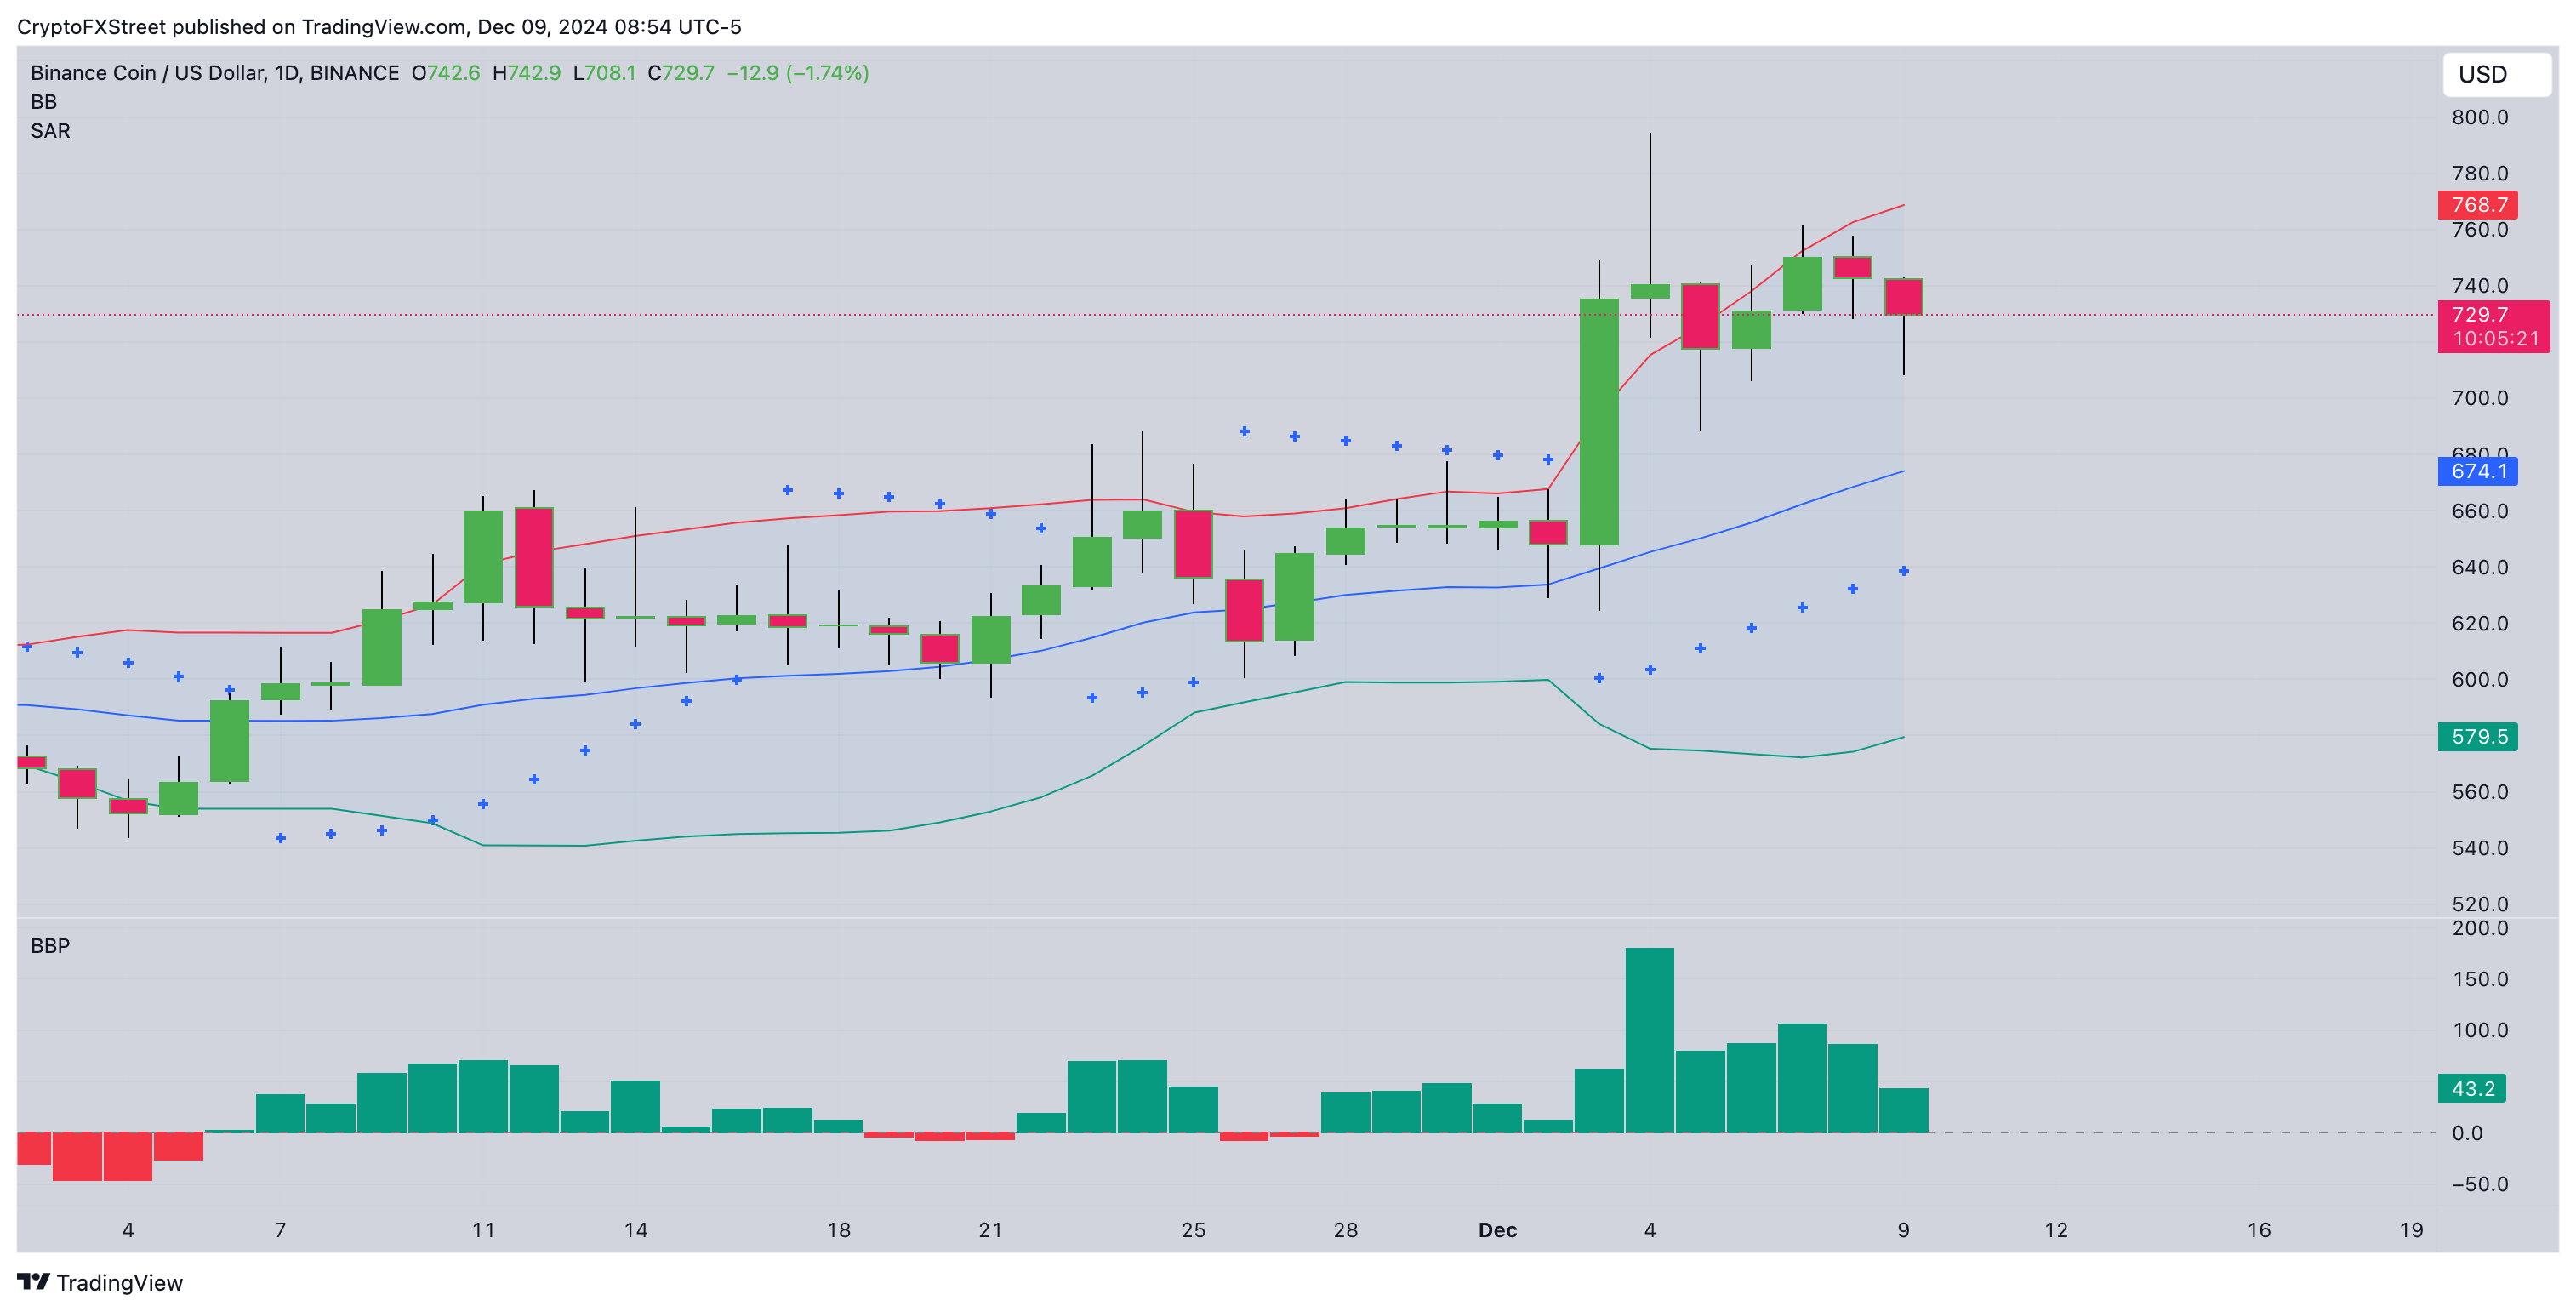
From a technical perspective, the Bollinger Bands, Parabolic SAR and BullBear Power (BBP) also affirm the positive BNB price forecast, with major resistance looming large at $800, while the $675 level acts as critical support.
As depicted below, the Bollinger Bands indicate a tightening range, suggesting BNB is consolidating ahead of a potential breakout.
The price is hovering near the upper band, a signal that bullish momentum is building. This aligns with Parabolic SAR’s recent shift below the price candles, which further supports an upward trajectory.
 BNB Price Forecast | BNBUSDT
Meanwhile, the BBP indicator shows positive values, signifying growing buyer strength.
Sustained positive BBP can propel BNB toward a breakout above $800, with $850 as the next major target.
On the flip side, a breakdown below the critical support zone at $675 may invalidate the bullish outlook.

