Litecoin Price Forecast: Whales invest $950M in 73-day buying spree amid LTC ETF approval rumours
- Litecoin traded below $88 on Tuesday, a steep 17% decline from the November 23 high of $106.
- Litecoin whales has recorded 73 consecutive days of positive net inflows.
- During this 73-day buying spree, whale wallets acquired 13.2 million LTC for $946.6 million.
Litecoin price hit $87.90 on Tuesday, down 17% from the recent high of $106 recorded on November 23. Despite the steep correction phase, on-chain data shows crypto whales have entered a 73-day buying spree.
Litecoin price loses $90 support amid cascading liquidations
After US Securities & Exchange Commission (SEC) Chair Gary Gensler’s announced exit, major altcoin markets received a boost.
Notably, crypto assets under litigation and those with ongoing ETF applications including Solana, LTC and XRP all recorded considerable gains last week.
However, as Bitcoin price stalled below $100,000, the ensuing sell-off sent bearish headwinds across the altcoin market.

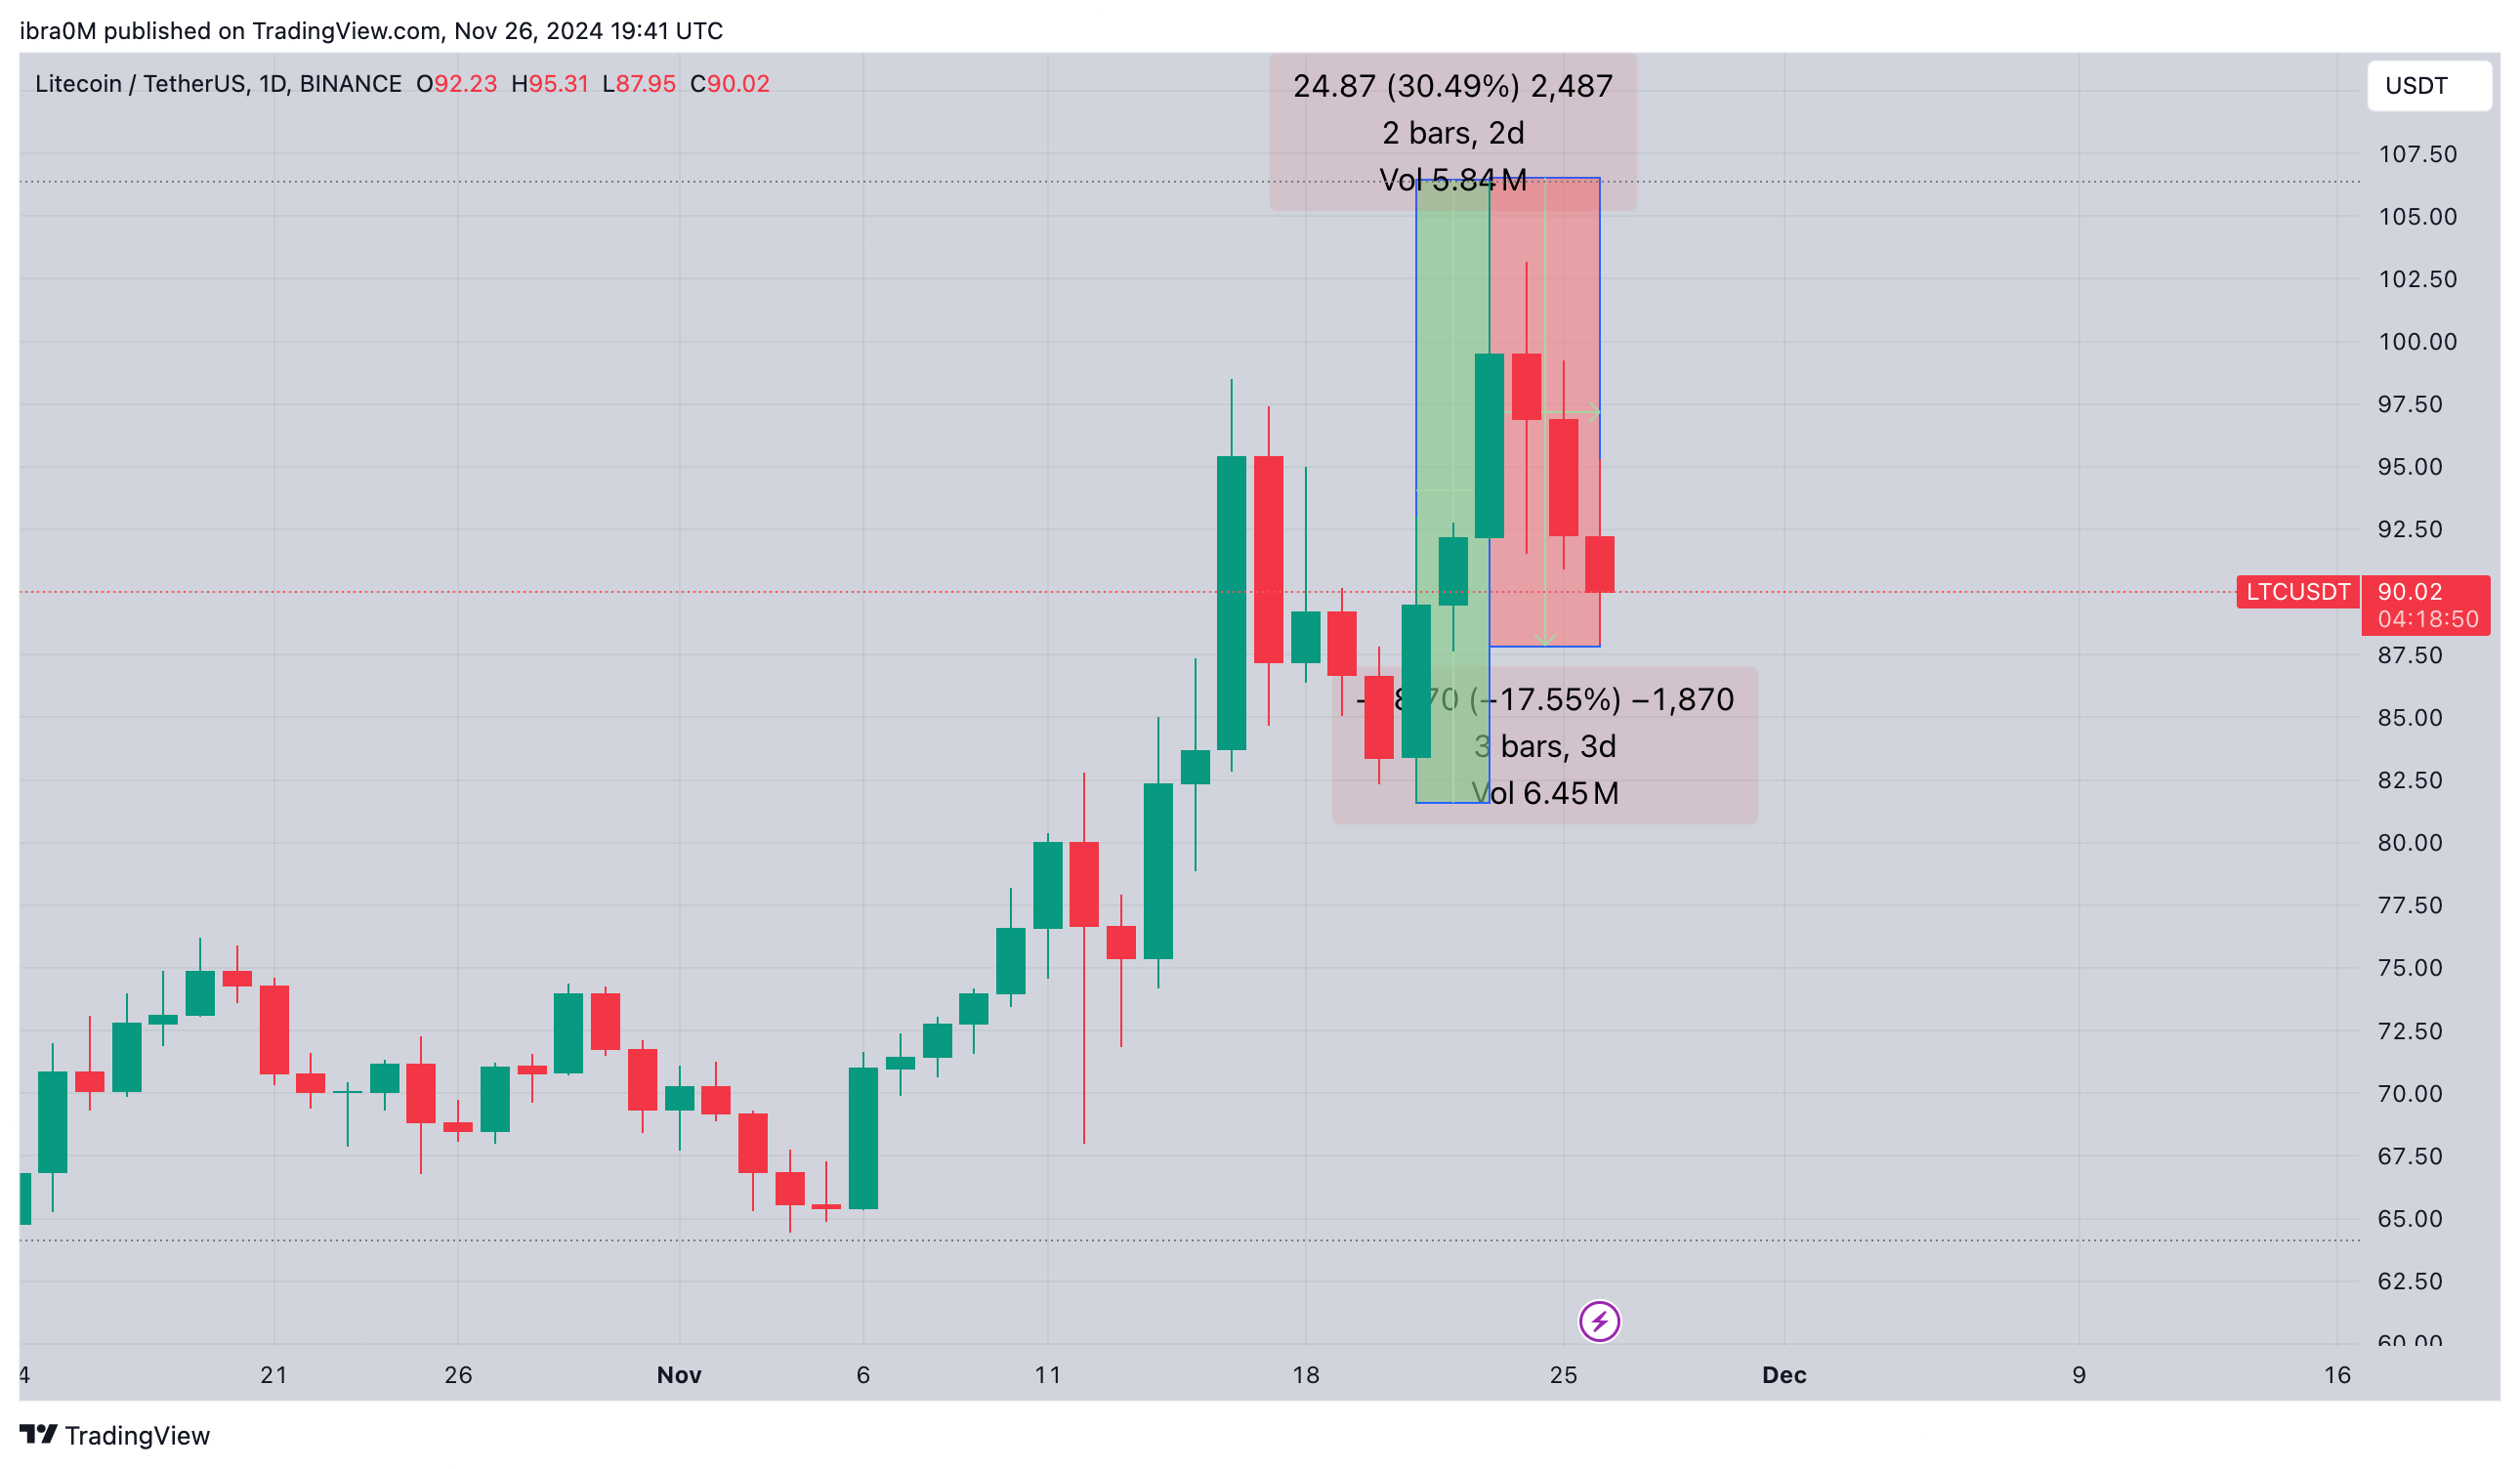
Litecoin price action | LTCUSD
The chart above shows how Litecoin price gained 31% within 48 hours of Gensler’s exit announcement, moving from $81.50 on November 21 to a five-month peak of $106 on November 23.
However, as BTC price retraced below the $92,000 mark on Tuesday, Litecoin mirrored the market downtrend, reversing 17% of last week’s gains.
Whales invest $950 million in 73-day buying spree
At first glance, Litecoin’s 31% rally last week appears largely driven by speculative demand from traders betting on Gensler exit improving chances of an LTC ETF approval.
However, a closer look at the on-chain data trends shows a prolonged whale accumulation trend underpinning the recent Litecoin price breakout.
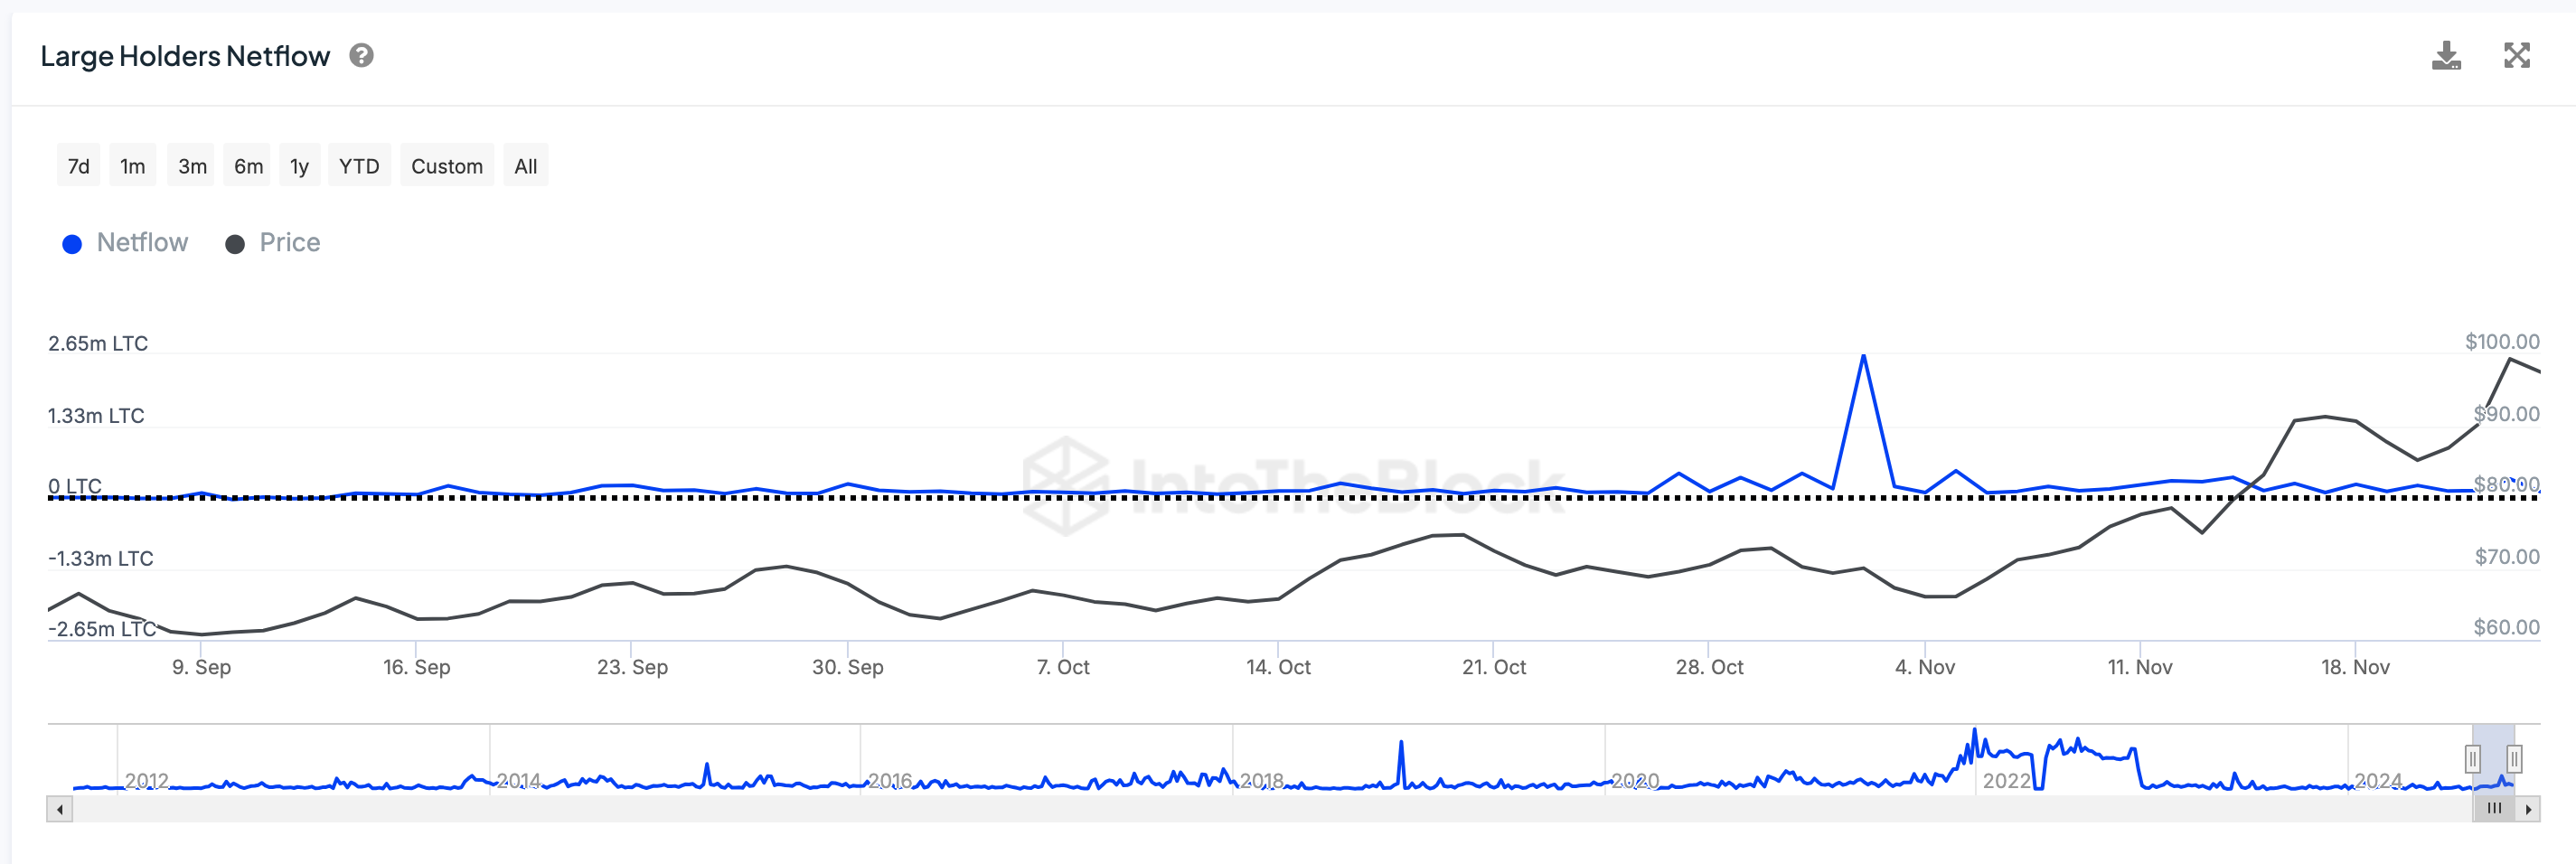
IntoTheBlock’s Large Holders’ netflow data tracks the daily deposits and withdrawals from wallets holding at least 0.1% of Litecoin circulation supply.
 Litecoin Large Holders’ Netflow | LTCUSD
As depicted above, the Litecoin whales have recorded positive net flows in 73 consecutive days, dating back to September 14, acquiring 13.2 million LTC, at the average price of $946.6 million.
When whales acquire such a large amount of coins, it triggers positive sentiment for two key reasons.
First, it signals that Litecoin’s largest stakeholders maintain a bullish outlook for LTC’s long-term potential.
With the LTC ETF approval in sight, this trend could linger, potentially driving Litecoin price above $100 when market demand returns.
Additionally, large-scale whale purchases reduce the circulating supply of Litecoin on exchanges, creating potential scarcity.
This supply-demand imbalance can increase the likelihood of upward price movements, enhancing Litecoin's appeal to new market entrants.
LTC Price Forecast: All eyes on $85 support
Litecoin (LTC) is showing signs of cautious consolidation following a sharp 15% decline from its recent peak of $106.
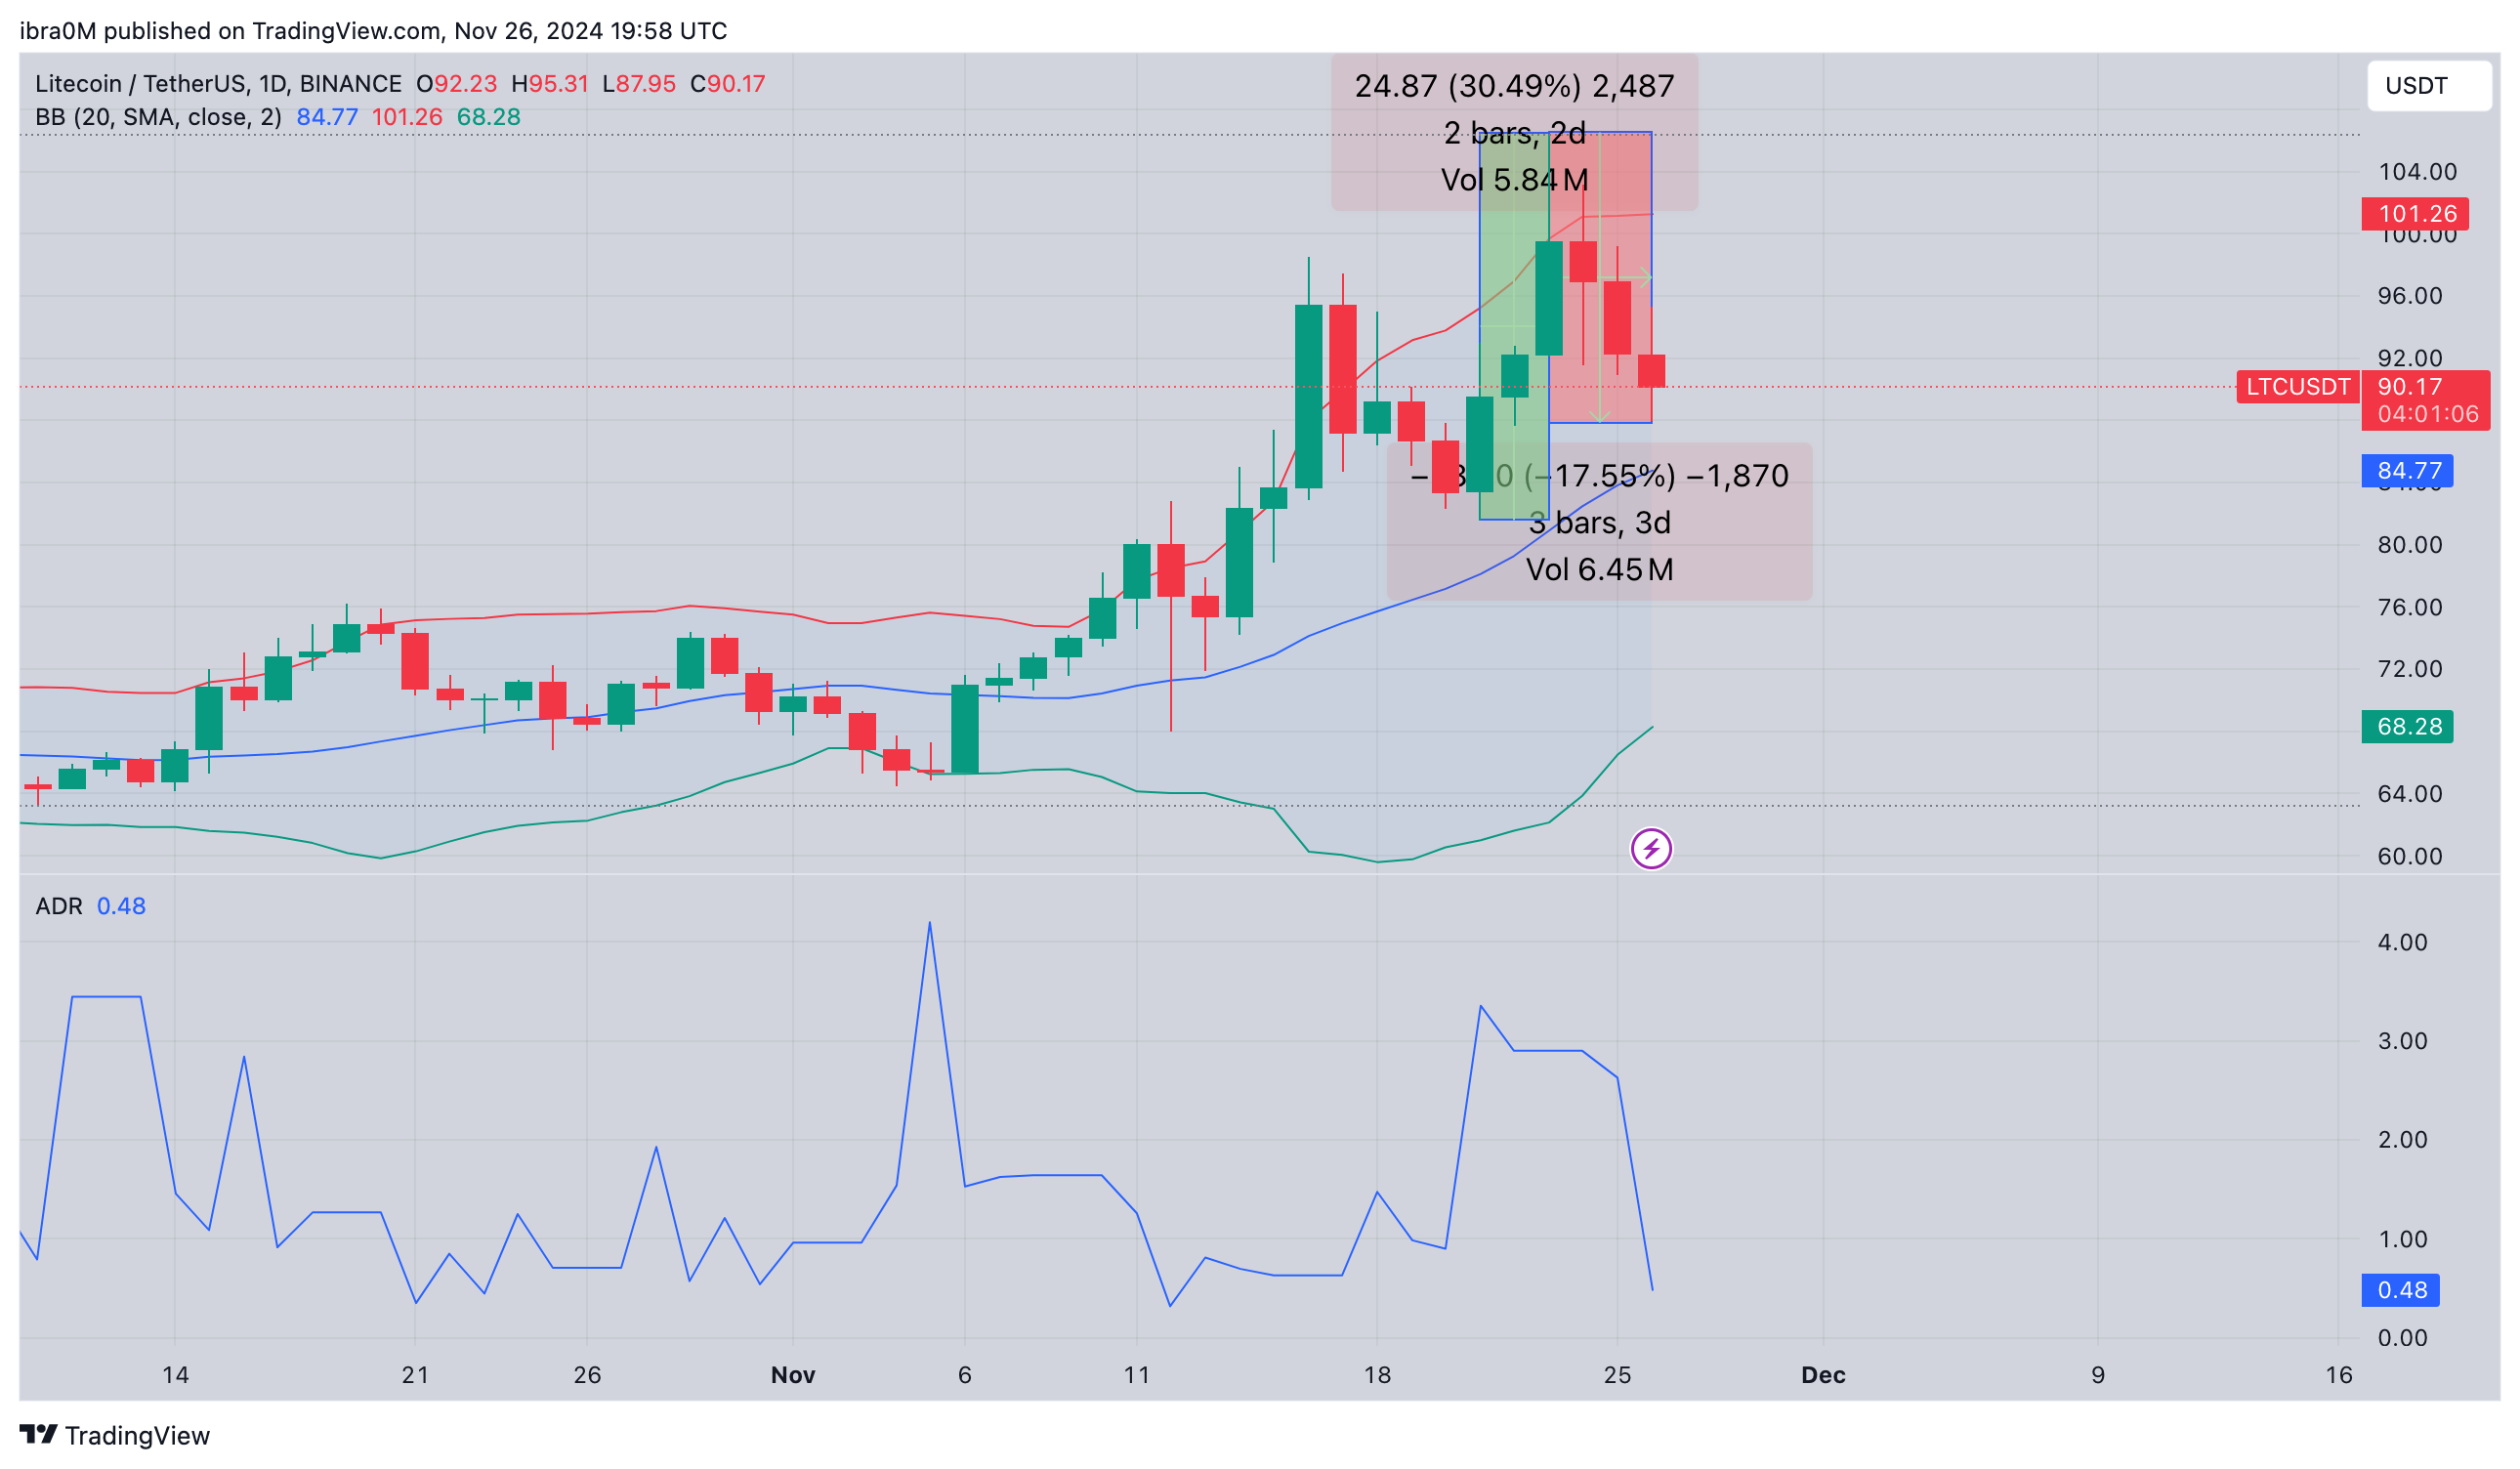
LTC price has retraced to the $90 level, with immediate support identified near the lower Bollinger Band at $85. This level is critical as it coincides with a confluence of previous demand zones and the 20-day Simple Moving Average (SMA).

Litecoin price forecast | LTCUSD
On the upside, resistance lies at $101, the upper Bollinger Band, which LTC failed to sustain during its recent rally.
The Average Daily Range (ADR) suggests declining volatility, which could signal consolidation before the next significant move.
A breach below $85 could expose LTC to further downside toward $68, while a rebound might target $96 and $101 as potential recovery zones.

