Bitcoin Price Forecast: BTC whales buy recent dips
Bitcoin price today: $98,300
- Bitcoin price trades in green on Monday after rallying almost 9% and hitting a new all-time high of $99,588 the previous week.
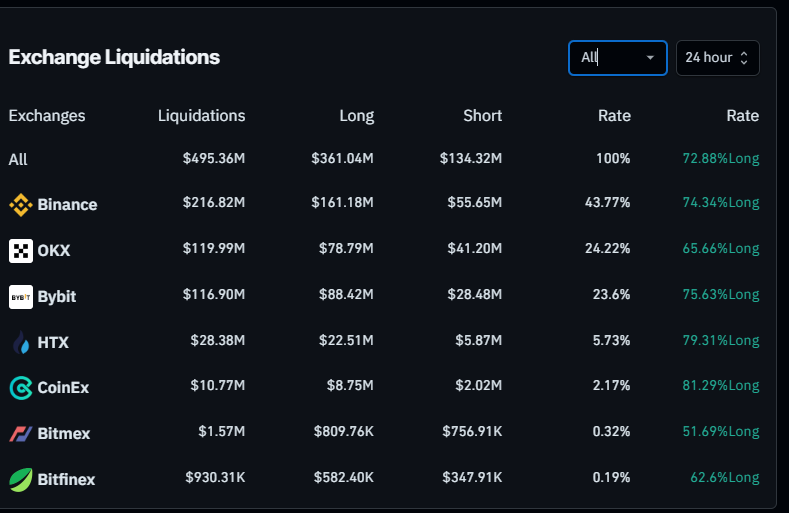
- Coinglass data shows the recent price drop on Sunday resulted in almost $500 million in total liquidations, more than $80 million specifically in BTC.
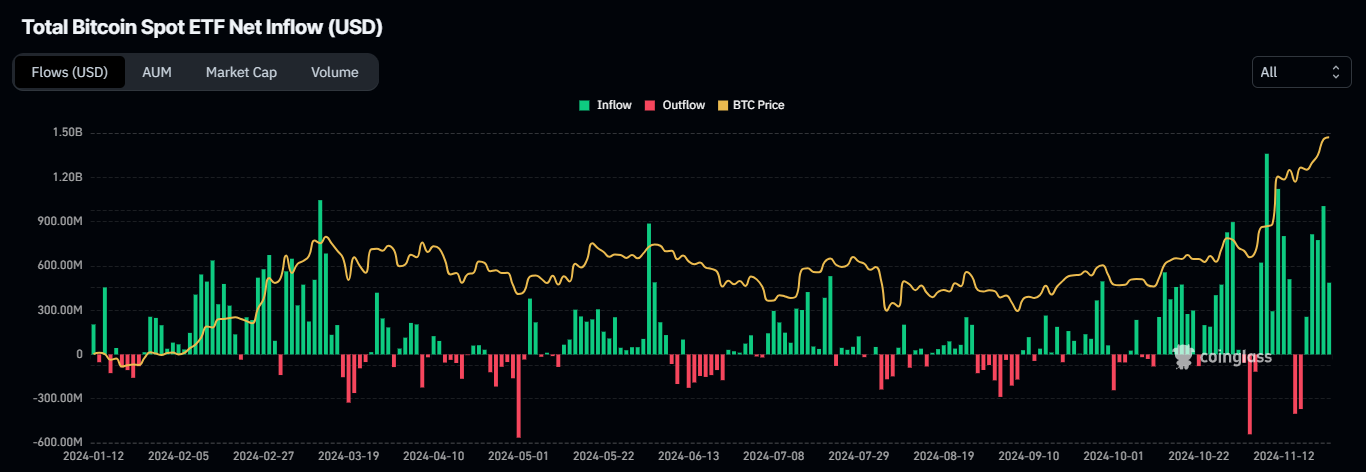
- On-chain data paints a bullish picture as US spot Bitcoin ETFs show a $3.34 billion net inflow last week and whales accumulating weekend dips.
Bitcoin (BTC) recovers from its weekend drop and trades higher above the $98,000 level on Monday after rallying almost 9% and hitting a new all-time high (ATH) of $99,588 last week. Coinglass data shows that the recent fall during the weekend wiped out almost $500 million in total liquidations, more than $80 million specifically in BTC. However, on-chain data projects a bullish outlook, as US spot Bitcoin Exchange Traded Funds (ETFs) show a $3.34 billion net inflow last week and whales accumulating weekend dips.
Bitcoin whales and institutional remain strong
Bitcoin price reached a new all-time high of $99,588 on Friday, just $412 away from the $100,000 milestone. However, during the weekend, BTC dipped 3.8%, reaching a low of $95,734 on Sunday, but quickly recovered and closed at $97,900.
BTC’s drop triggered a wave of liquidations across the crypto market, resulting in almost $500 million in total liquidations in the last 24 hours, more than $80 million specifically in BTC, according to data from CoinGlass.

Exchange Liquidations chart. Source: Coinglass
Despite the recent dip in Bitcoin, whales are still accumulating BTC. Lookonchain data shows that six fresh wallets withdrew 1,110 BTC worth $107.7 million from Binance on Sunday. Additionally, Data Nerd data also shows that three wallets accumulated 702.2 BTC worth $68.6 million from Binance on Saturday.
Whales are still accumulating $BTC after the price drops!
— Lookonchain (@lookonchain) November 24, 2024
In the past 8 hours, 6 fresh wallets withdrew 1,110 $BTC($107.7M) from #Binance.
Address:
bc1pg4f9pllrjmr8d0svxm5rmzjyxuck08nka0h6wpmn98s0meyypv6sxu0pk3
bc1qzuuct2095a87p400xc3tnq7kj9u5gumsqsx3gq… pic.twitter.com/0YVg33CzMu
Moreover, institutional flows are also accumulating Bitcoin. According to Coinglass ETF data, US spot Bitcoin ETFs experienced a total net inflow of $3.34 billion last week, compared to $1.78 billion the previous week. If this inflow trend persists or accelerates, it could provide additional momentum to the ongoing Bitcoin price rally.


Total Bitcoin Spot ETF Net Inflow chart. Source: Coinglass
Traders should remain cautious as Bitcoin (BTC) approaches the $100,000 milestone. Profit-taking is a natural part of any price rally, and early signs of this are already emerging in the ongoing uptrend. According to CryptoQuant, the Short-Term Spent Output Profit Ratio (SOPR) indicator measures profits realized on coins held for more than 1 hour but less than 155 days. For this analysis, short-term investors hold Bitcoin for less than 155 days.
Historically, when using a 30-day moving average to the Short-Term SOPR, it has been observed that during bullish trends, the metric tends to reach around 1.02 before profit-taking occurs. Each time this level has been reached, Bitcoin’s price has experienced a pullback or correction.
On Monday, the metric stands at 1.02, suggesting that Bitcoin’s price could face a short-term correction. However, if capital inflows into the market continue and investors remain eager to buy Bitcoin, this historical pattern could be overridden, leading to a strong breakout beyond $100,000.
-638681354985638772.png)
Bitcoin Short Term Holder chart. Source: CryptoQuant
Bitcoin Price Forecast: Inches from $100,000 milestone
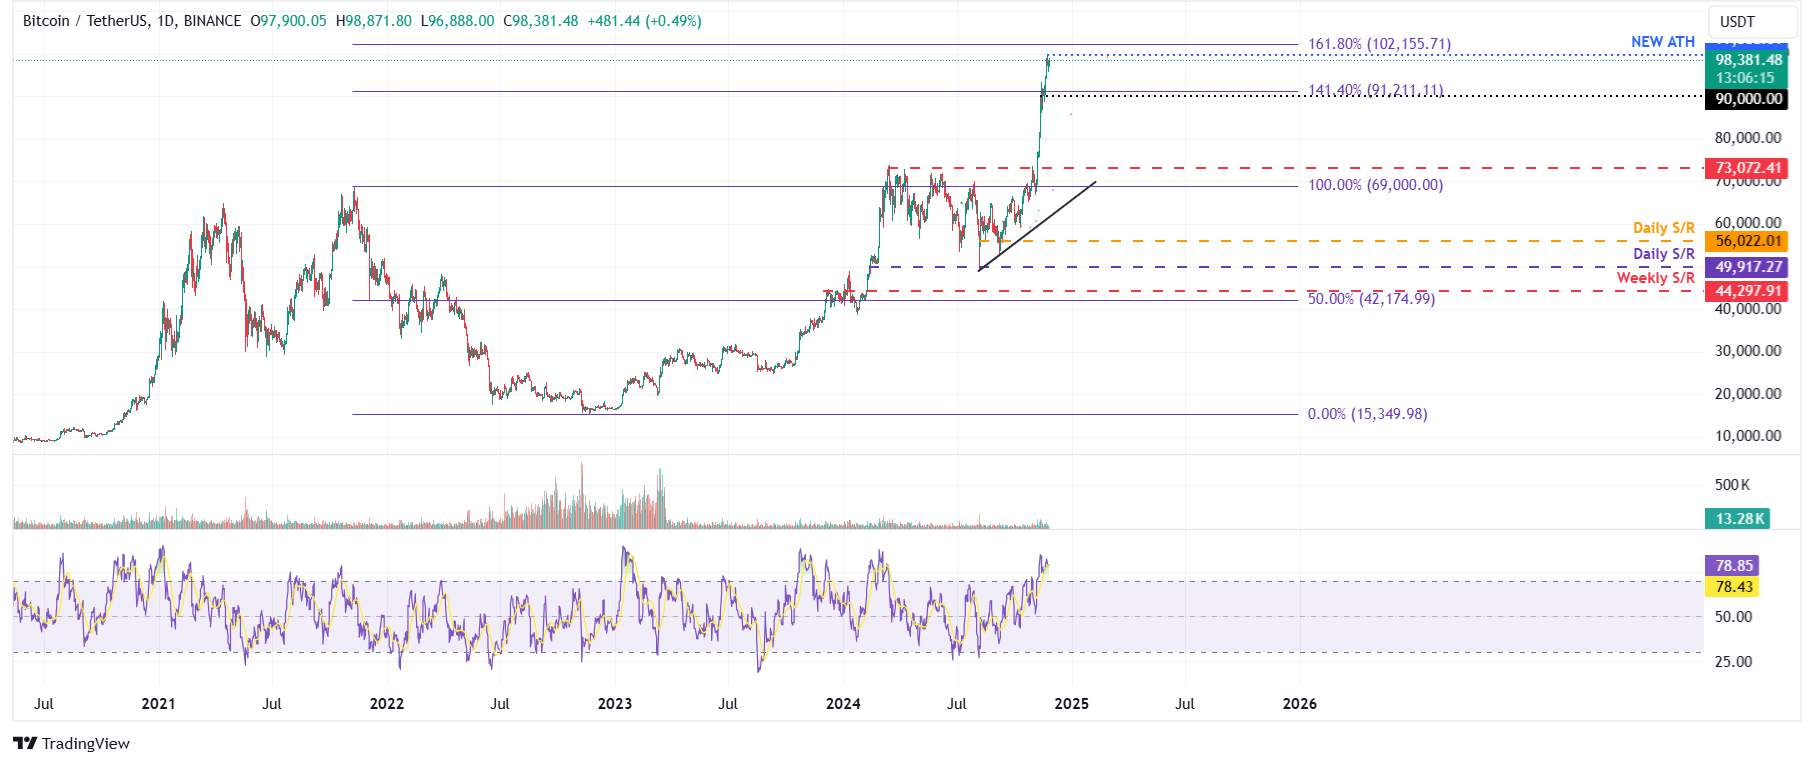
Bitcoin price rallied more than 40% in the last three weeks, hitting a new ATH of $99,588 on Friday. If BTC continues its upward momentum, it could extend the rally to retest the significant psychological level of $100,000.
However, the Relative Strength Index (RSI) momentum indicator stands at 78, signaling overbought conditions and suggesting an increasing risk of a correction. Traders should exercise caution when adding to their long positions, as the RSI’s move out of the overbought territory could provide a clear sign of a pullback.

BTC/USDT daily chart
If Bitcoin faces a pullback, it could decline to retest its key psychological level of $90,000.
Bitcoin, altcoins, stablecoins FAQs
Bitcoin is the largest cryptocurrency by market capitalization, a virtual currency designed to serve as money. This form of payment cannot be controlled by any one person, group, or entity, which eliminates the need for third-party participation during financial transactions.
Altcoins are any cryptocurrency apart from Bitcoin, but some also regard Ethereum as a non-altcoin because it is from these two cryptocurrencies that forking happens. If this is true, then Litecoin is the first altcoin, forked from the Bitcoin protocol and, therefore, an “improved” version of it.
Stablecoins are cryptocurrencies designed to have a stable price, with their value backed by a reserve of the asset it represents. To achieve this, the value of any one stablecoin is pegged to a commodity or financial instrument, such as the US Dollar (USD), with its supply regulated by an algorithm or demand. The main goal of stablecoins is to provide an on/off-ramp for investors willing to trade and invest in cryptocurrencies. Stablecoins also allow investors to store value since cryptocurrencies, in general, are subject to volatility.
Bitcoin dominance is the ratio of Bitcoin's market capitalization to the total market capitalization of all cryptocurrencies combined. It provides a clear picture of Bitcoin’s interest among investors. A high BTC dominance typically happens before and during a bull run, in which investors resort to investing in relatively stable and high market capitalization cryptocurrency like Bitcoin. A drop in BTC dominance usually means that investors are moving their capital and/or profits to altcoins in a quest for higher returns, which usually triggers an explosion of altcoin rallies.

