Top 3 Price Prediction Bitcoin, Ethereum, Ripple: BTC nears $100K as SEC’s Gensler tenders resignation
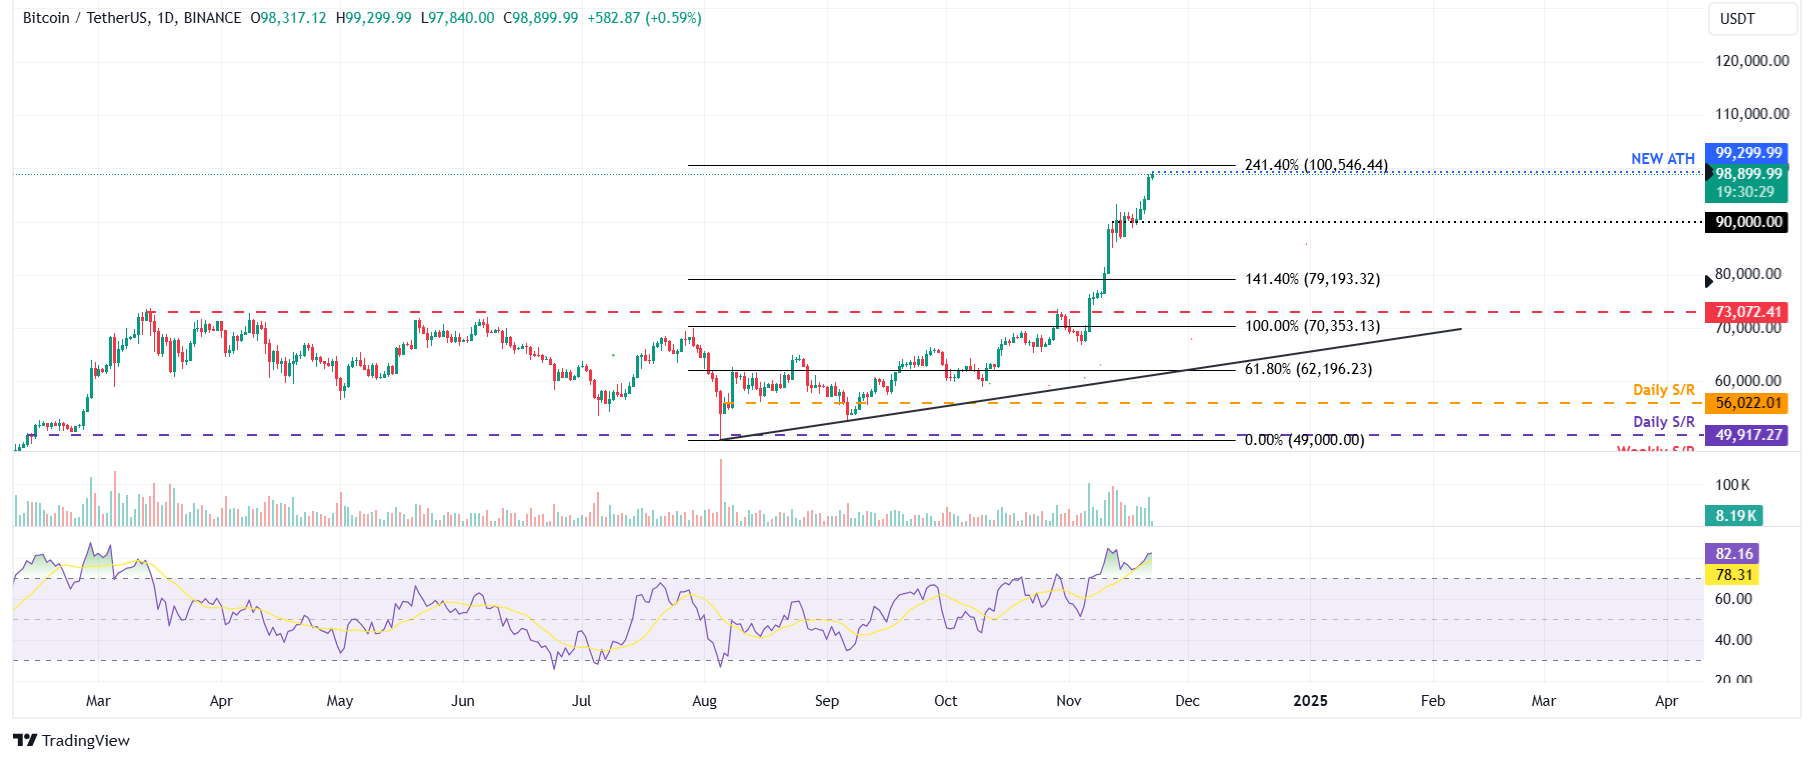
- Bitcoin hit a new all-time high of $99,299 on Friday, inches to the $100K milestone.
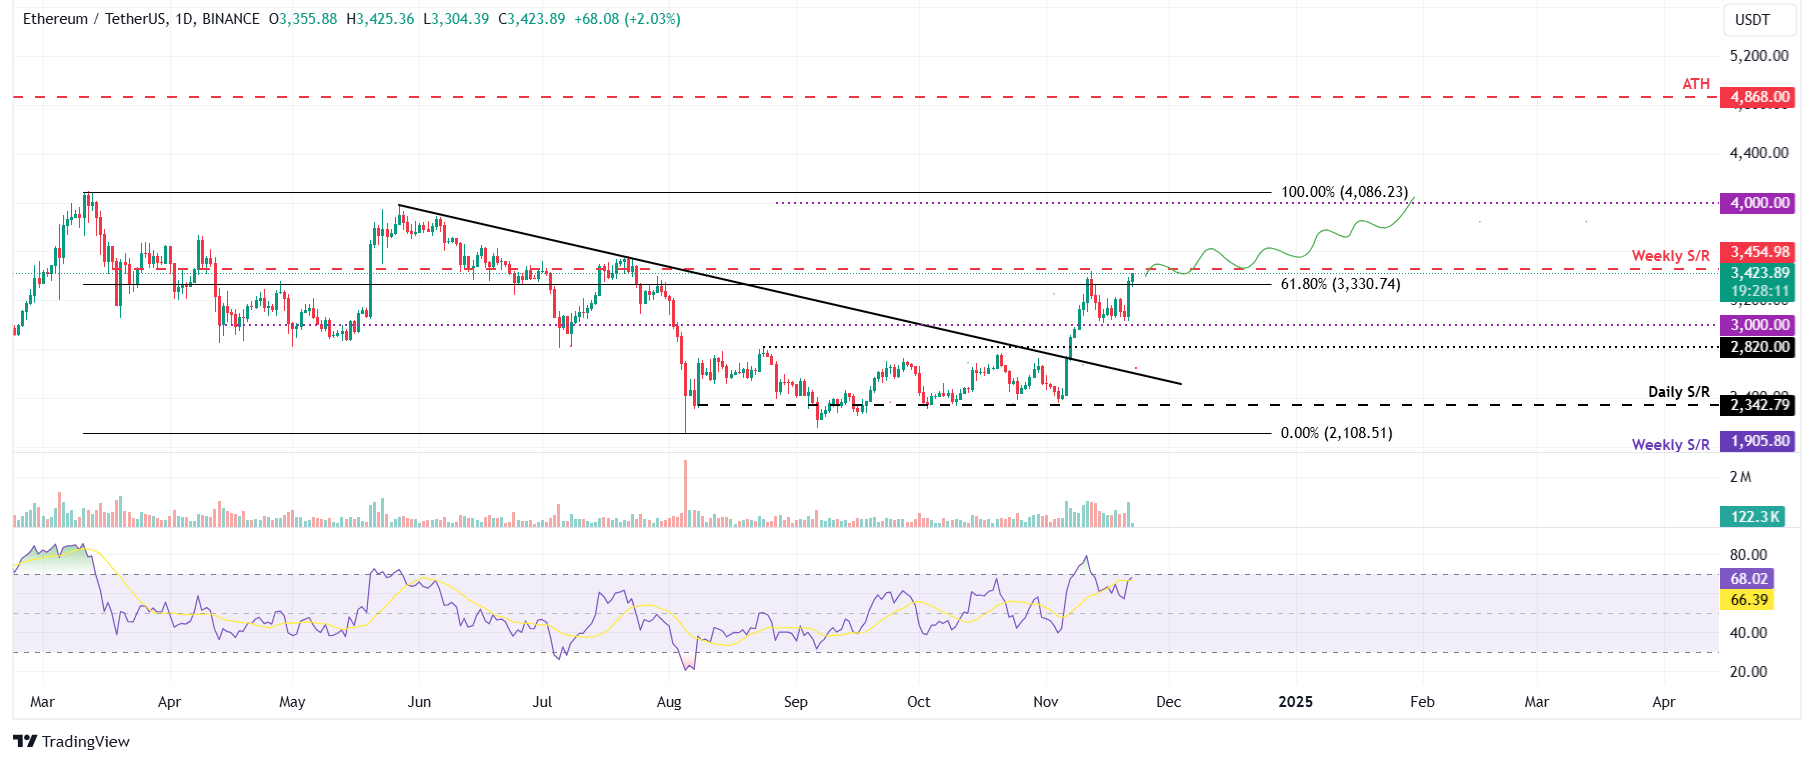
- Ethereum is nearing its $3,454 weekly resistance; a firm close above suggests a continuation of the rally to $4,000.
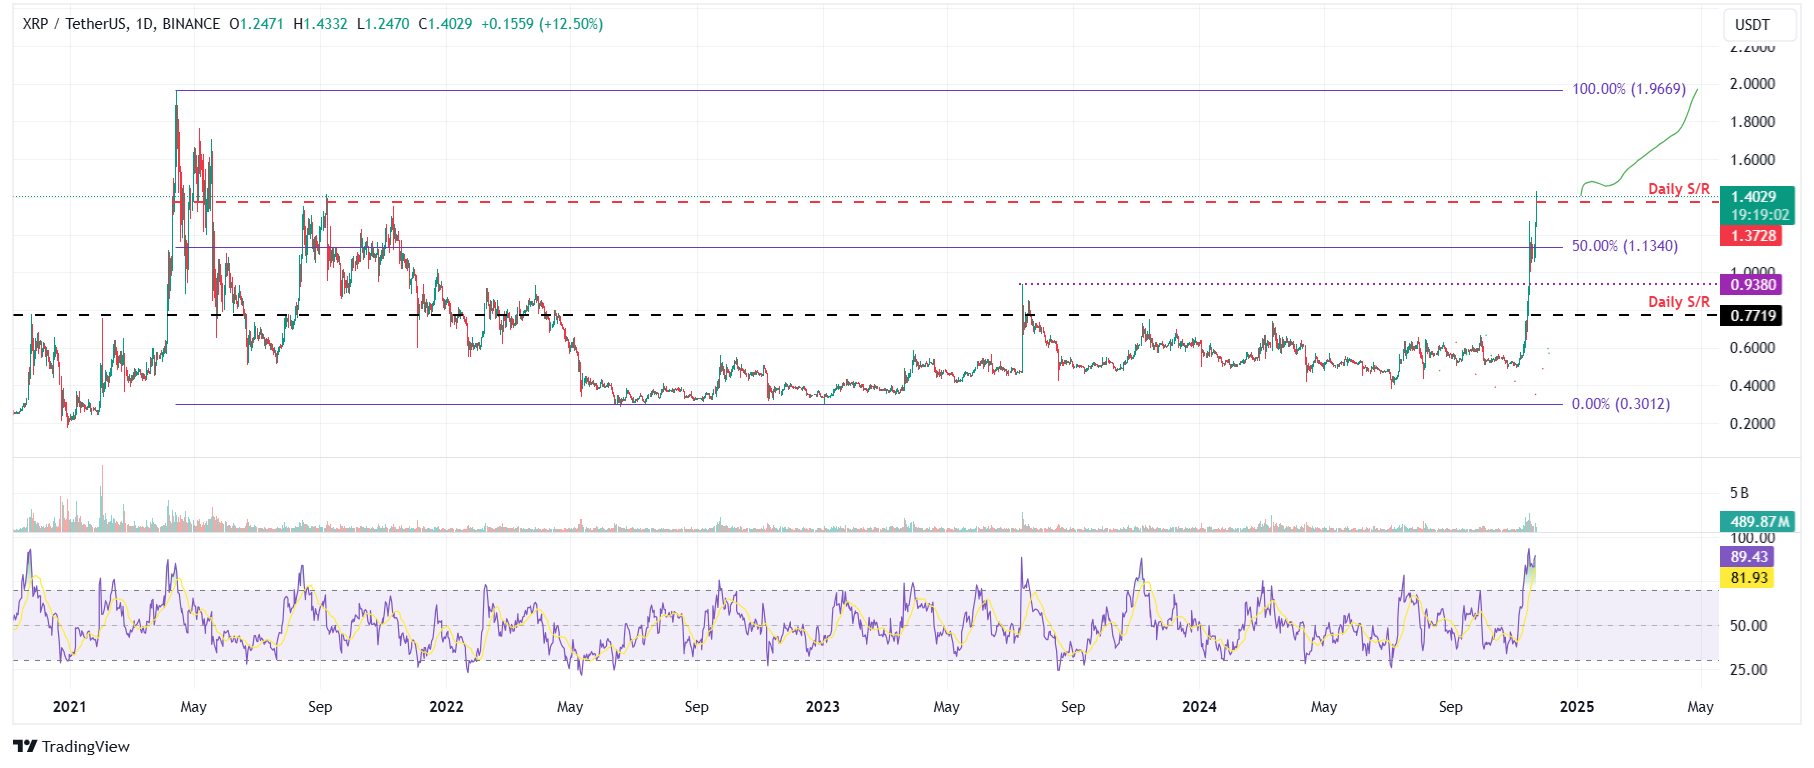
- Ripple price sustained its break above the $1.37 daily resistance, indicating further gains.
Bitcoin (BTC) surges to a new all-time high of $99,299 on Friday, just shy of the $100K milestone following reports of Securities & Exchange Commission (SEC) Chair Gary Gensler's upcoming resignation on Thursday. Ethereum (ETH) and Ripple (XRP) followed BTC’s move and rallied, approaching key resistance levels. A decisive close above these points signals the potential for further upward momentum.
Bitcoin price inches closer to $100K milestone
Bitcoin price has rallied more than 10% so far this week, reaching a new all-time high of $99,229 on Friday and is currently trading above $98,800. If BTC continues its upward momentum, it could extend the rally to retest the significant psychological level of $100,000.
However, the Relative Strength Index (RSI) momentum indicator stands at 82, signaling overbought conditions and suggesting an increasing risk of a correction. Traders should exercise caution when adding to their long positions, as the RSI’s move out of the overbought territory could provide a clear sign of a pullback.

BTC/USDT daily chart
If Bitcoin faces a pullback, it could decline to retest its key psychological level of $90,000.
Ethereum bulls show potential for further gains
Ethereum price surged more than 9% on Thursday, closing above its 61.8% Fibonacci retracement level at $3,300. On Friday, it extends its gains, trading above $3,420, approaching its weekly resistance at $3,454.
If ETH breaks and closes above $3,454, it could extend the rally to its psychologically important $4,000 level.
The RSI on the daily chart reads at 68, above its neutral level of 50 and points upwards, indicating that bullish momentum is gaining traction.

ETH/USDT daily chart
However, if ETH fails to close above the $3,454 weekly resistance, it could face a pullback to retest its $3,000 support level.
Ripple bulls aim for three-year high of $1.96
Ripple price surged almost 13% on Thursday following SEC Chair Gary Gensler's announcement that he would be stepping down from his role in the agency on January 20. On Friday, XRP extents its gains by 12%, breaking above its daily resistance of $1.37.
If XRP closes above the $1.37 level, it will extend the rally and retest its three-year high of $1.96 (April 2021).
However, the RSI stands at 89, signaling overbought conditions and suggesting an increasing risk of a correction. Traders should exercise caution when adding to their long positions, as the RSI’s move out of the overbought territory could provide a clear sign of a pullback.

XRP/USDT daily chart
If XRP faces a pullback, it could decline to retest its key psychological level of $1.00.Bitcoin, altcoins, stablecoins FAQs
Bitcoin is the largest cryptocurrency by market capitalization, a virtual currency designed to serve as money. This form of payment cannot be controlled by any one person, group, or entity, which eliminates the need for third-party participation during financial transactions.
Altcoins are any cryptocurrency apart from Bitcoin, but some also regard Ethereum as a non-altcoin because it is from these two cryptocurrencies that forking happens. If this is true, then Litecoin is the first altcoin, forked from the Bitcoin protocol and, therefore, an “improved” version of it.
Stablecoins are cryptocurrencies designed to have a stable price, with their value backed by a reserve of the asset it represents. To achieve this, the value of any one stablecoin is pegged to a commodity or financial instrument, such as the US Dollar (USD), with its supply regulated by an algorithm or demand. The main goal of stablecoins is to provide an on/off-ramp for investors willing to trade and invest in cryptocurrencies. Stablecoins also allow investors to store value since cryptocurrencies, in general, are subject to volatility.
Bitcoin dominance is the ratio of Bitcoin's market capitalization to the total market capitalization of all cryptocurrencies combined. It provides a clear picture of Bitcoin’s interest among investors. A high BTC dominance typically happens before and during a bull run, in which investors resort to investing in relatively stable and high market capitalization cryptocurrency like Bitcoin. A drop in BTC dominance usually means that investors are moving their capital and/or profits to altcoins in a quest for higher returns, which usually triggers an explosion of altcoin rallies.


