Cardano Price Forecast: On-chain metrics and technical outlook signal bearish trend

Fonte Fxstreet
  • Cardano’s price was rejected by its ascending trendline pullback, suggesting a decline ahead.
  • Artemis data shows decreasing daily trading volume, suggesting a fall in traders’ interest and liquidity in the ADA chain.
  • A daily candlestick close above $0.367 would invalidate the bearish thesis.

Cardano (ADA) is trading slightly down around $0.33 on Monday, struggling against resistance from its previously broken ascending trendline. Declining daily trading volume reinforces a bearish outlook, indicating reduced trader interest and liquidity in the ADA chain.

Cardano shows signs of weakness 

Cardano price broke and closed below the ascending trendline (drawn by joining multiple low levels since August ) on Friday, after rejection and declining 9.2% from the 50% price retracement level at $0.367 since Wednesday. It recovered slightly to retest the broken trendline and was rejected. On Monday, it declines slightly, trading around $0.332, facing resistance from the broken trendline at around $0.342.

If the $0.342 holds as resistance, ADA could decline over 9% to retest its September 6 low of $0.303.

The Relative Strength Index (RSI)  indicator on the daily chart reads 42,  below its neutral level of 50, indicating increasing bearish momentum.
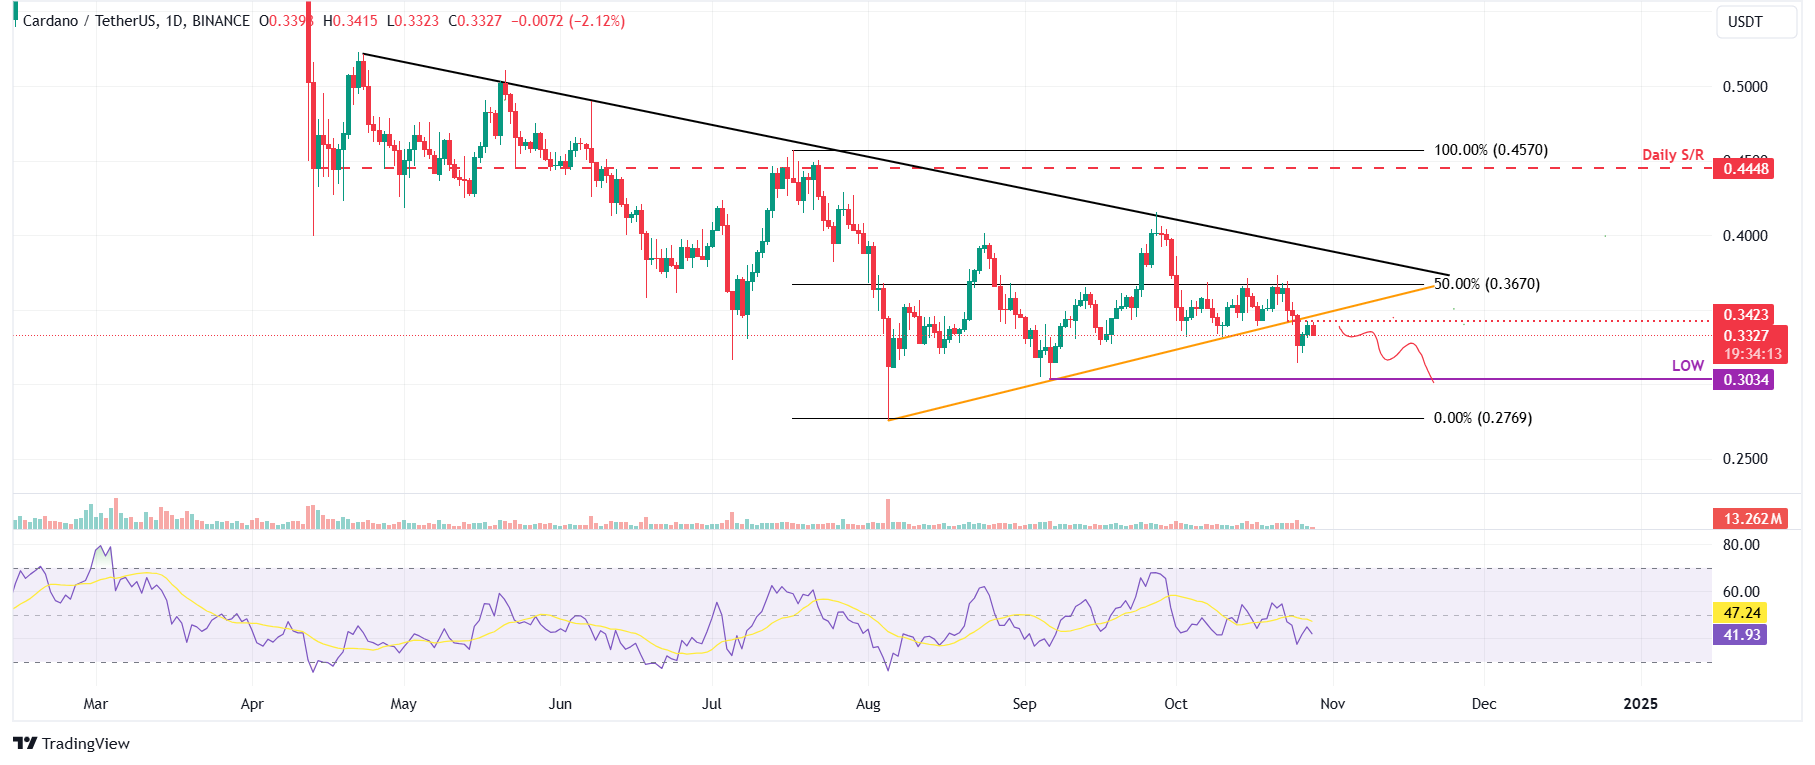
ADA/USDT daily chart

ADA/USDT daily chart

Based on IntoTheBlock’s In/Out of the Money Around Price (IOMAP), nearly 119,360 addresses accumulated 2.27 billion ADA tokens at an average price of $0.336. These addresses bought the tokens previously for between $0.332 and $0.341 and would likely sell them to get out at a breakeven price, which makes it a key resistance zone. 

Interestingly, the zone mentioned from a technical analysis perspective, the $0.341 level, coincides with the IOMAP findings, making this zone a key reversal area to watch.
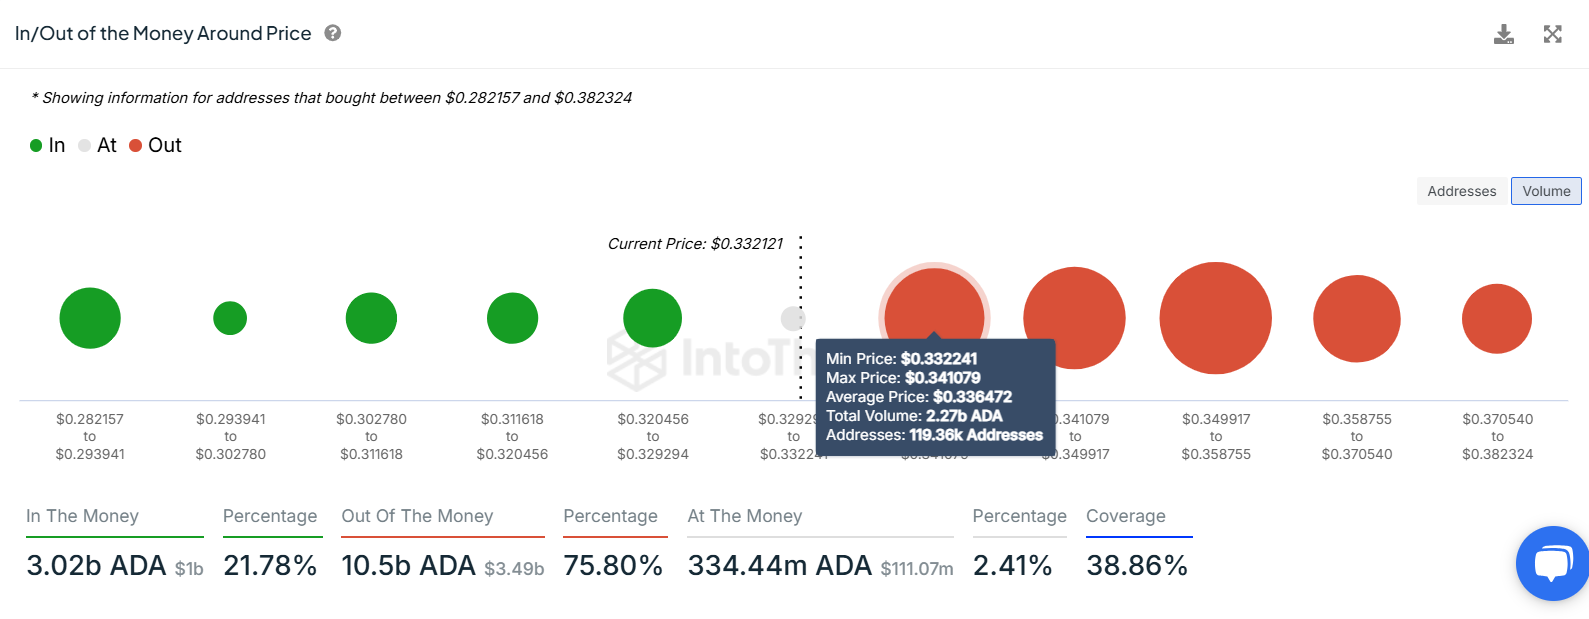
Cardano IOMAP chart. Source: IntoTheBlock

Cardano IOMAP chart. Source: IntoTheBlock

Another aspect bolstering the platform’s bearish outlook is a fall in traders’ interest and liquidity in the ADA chain. Artemis Terminal data shows that ADA’s daily trading volume fell from $545 million on Friday to $197 million on Sunday, the lowest level since early October and has been constantly declining since mid-February.

ADA daily trading volume chart. Source: Artemis Terminal

ADA daily trading volume chart. Source: Artemis Terminal

However, the bearish thesis would be invalidated if ADA breaks and closes above the $0.367. This scenario could result in a rise in Cardano’s price to retest its September 27 high of $0.415.

Isenção de responsabilidade: Apenas para fins informativos. O desempenho passado não é indicativo de resultados futuros.
placeholder
O fundador da Cardano afirma que a ADA superará o BTC e o ETH: gabar-se vazia ou possibilidade real? Charles Hoskinson ameaçou superar o BTC e o ETH, mas o ADA está muito atrás em termos de valor de mercado e TVL, e não pode ser comparado a ele.
Autor  Mitrade Team
29 ago. 2023
Charles Hoskinson ameaçou superar o BTC e o ETH, mas o ADA está muito atrás em termos de valor de mercado e TVL, e não pode ser comparado a ele.
placeholder
UBS eleva projeções para o ouro, prevendo valorização até 2025Investing.com — O UBS revisou suas previsões para o preço do ouro, esperando novos ganhos para o metal precioso no próximo ano.O banco agora projeta que o ouro alcançará 2.750 dólares por onça até o f
Autor  Investing.com
9 Mês 27 Dia Sex
Investing.com — O UBS revisou suas previsões para o preço do ouro, esperando novos ganhos para o metal precioso no próximo ano.O banco agora projeta que o ouro alcançará 2.750 dólares por onça até o f
placeholder
AMERICANAS EXPLODIU HOJE! VALE A PENA COMPRAR AS AÇÕES DE AMERICANAS? AMER3 ANÁLISE TÉCNICA GRÁFICAAMER3 AMERICANAS S.A. BOMBA! Ação DISPARA quase 200% hoje. Será que vale a pena comprar AMER3?
Autor  Roberto Fernandes
11 Mês 18 Dia Seg
AMER3 AMERICANAS S.A. BOMBA! Ação DISPARA quase 200% hoje. Será que vale a pena comprar AMER3?
placeholder
Solana tem potencial para atingir US$ 4000? Veja opinião deste analistaInvesting.com – A solana, antes vista como uma figura secundária no universo das criptomoedas, marcada por falhas técnicas e pelo impacto do colapso da FTX, agora desponta como uma das maiores promess
Autor  Investing.com
12 Mês 12 Dia Qui
Investing.com – A solana, antes vista como uma figura secundária no universo das criptomoedas, marcada por falhas técnicas e pelo impacto do colapso da FTX, agora desponta como uma das maiores promess
placeholder
Fique por dentro das principais notícias do mercado desta quinta-feiraPor Peter Nurse e Jessica Bahia MeloInvesting.com -- Wall Street é vista se recuperando na quinta-feira após a derrota liderada pelo Fed na sessão anterior, com o Banco da Inglaterra sendo o próximo b
Autor  Investing.com
12 Mês 20 Dia Sex
Por Peter Nurse e Jessica Bahia MeloInvesting.com -- Wall Street é vista se recuperando na quinta-feira após a derrota liderada pelo Fed na sessão anterior, com o Banco da Inglaterra sendo o próximo b
Produtos relacionados
goTop
quote