

Bitcoin Price Forecast: BTC vulnerable despite surge in stablecoin market capitalization
Bitcoin price today: $61,000
- Bitcoin price closed below the $62,000 support on Wednesday, showing signs of weakness.
- CryptoQuant report shows how rising stablecoin market capitalization could be a positive sign for Bitcoin and other cryptocurrencies.
- US Spot Bitcoin ETFs recorded two straight days of outflows on Wednesday.
Bitcoin (BTC) price stabilizes around $61,000 on Thursday after closing below the key support level of $62,000 on Wednesday. This indicates a potential shift in market sentiment in the short term as institutional demand wanes, as shown by two straight days of outflows in US Spot Bitcoin Exchange Traded Funds (ETFs). However, the increasing stablecoin market capitalization could suggest underlying bullish sentiment and future recovery opportunities.
Bitcoin price could surge as stablecoin market cap reaches new high
CryptoQuant report on Tuesday highlights how the rising stablecoin market capitalization could be a positive sign for Bitcoin and other cryptocurrencies.
The report explains that liquidity in the crypto markets, measured by stablecoin value, reached a record high in late September. The graph below shows that the total market capitalization of major US Dollar-backed stablecoins is now $169 billion, up $40 billion, or 31%, year-to-date (YTD). Increased stablecoin market capitalization is generally associated with higher Bitcoin and crypto prices, as it provides more liquidity to the markets.
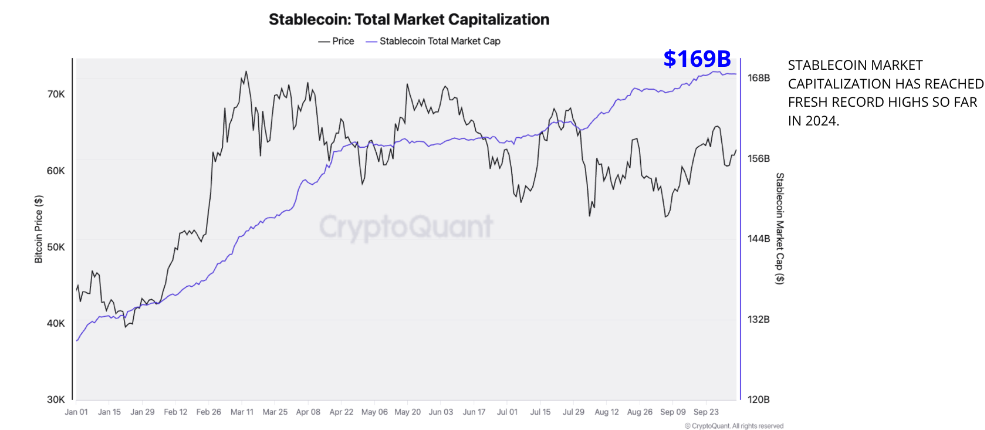
Stablecoin: Total Market Capitalization. Source: CryptoQuant
Moreover, the report mentions that larger balances of stablecoins on exchanges positively correlate with higher Bitcoin and crypto prices. Since January 2023, when the current bull cycle started, the total amount of USDT (ERC20) on exchanges has grown from $9.2 billion to $22.7 billion (+146%). Notably, these balances have grown by 20%, even as Bitcoin’s price has remained flat.
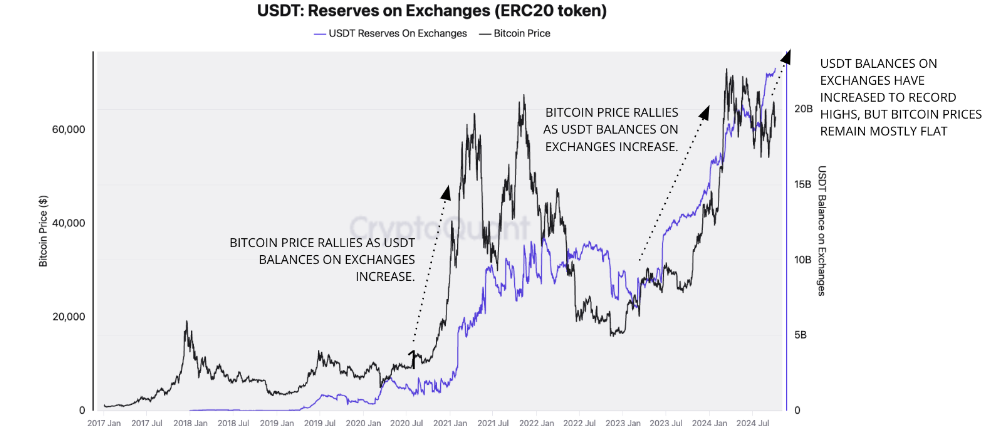
USDT: Reserve on Exchanges chart. Source: CryptoQuant
Furthermore, USDT and USDC’s market capitalization has continued to increase monthly, though slower than earlier in the year. The market capitalization of USDC is growing at a 2.1% monthly pace, compared to a peak of 14.4% in March 2024. Meanwhile, the USDT market cap is up 1.3% month-on-month (MoM), compared to its high of 6.6% in March. Accelerating the monthly growth of these stablecoins’ market capitalization could signal a new leg up for Bitcoin and crypto prices.
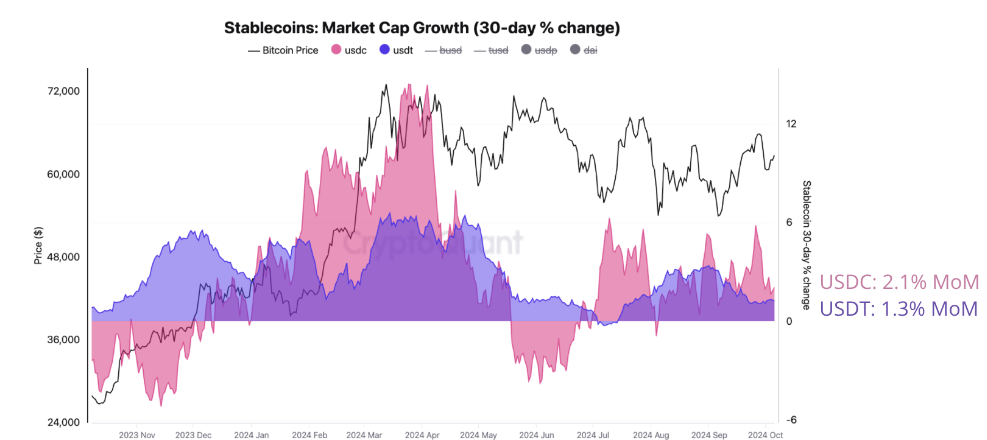
Stablecoin: Market Cap Growth (30-day % change chart. Source: CryptoQuant
However, Institutional demand still shows signs of weakness in the short term. According to Coniglass data, US Bitcoin Spot ETF recorded a slight outflow of $30.60 million on Wednesday. Studying the ETF flow data can be useful for observing institutional investors’ sentiment for Bitcoin. If the magnitude of outflow increases and continues, this trend would signal a fall in demand for Bitcoin, leading to its price decline.
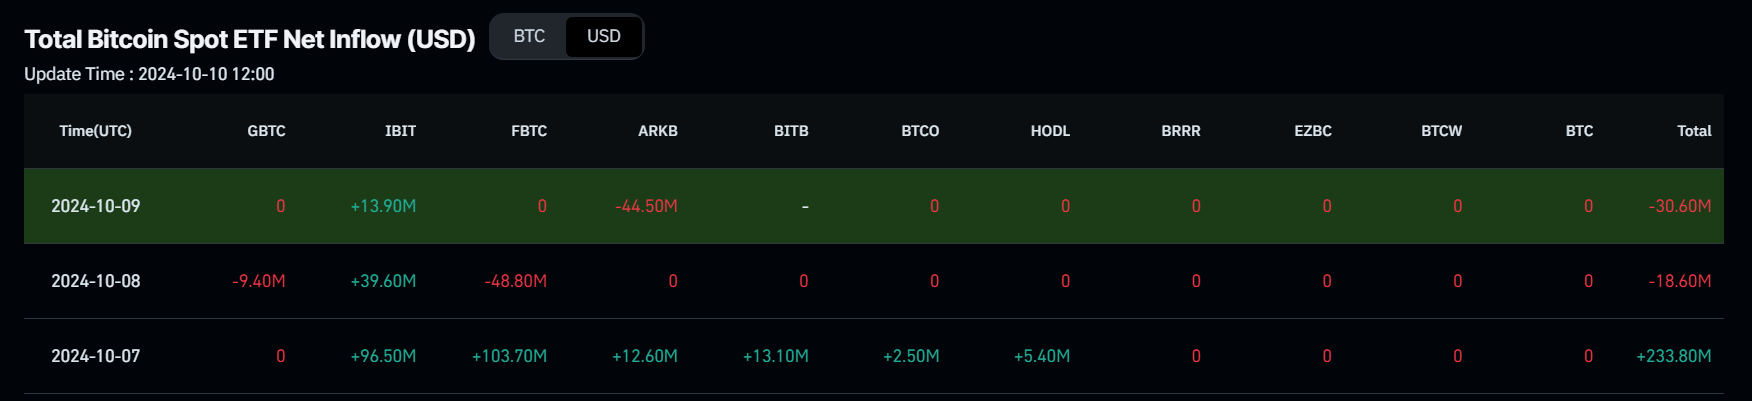
Total Bitcoin Spot ETF Net Inflow chart. Source: Coinglass
Bitcoin Price Forecast: BTC closes below $62,000 support level
Bitcoin’s price broke and closed below the $62,125 support level on Wednesday, erasing 2.45% of its value in the day. At the time of writing on Thursday, BTC trades near $61,000 and finds support around its 200-day Exponential Moving Average (EMA) at $60,024.
If it closes below $60,024, BTC could decline over 4% and retest its September 16 low of $57,493.
The Relative Strength Index (RSI) on the daily chart trades below its neutral level of 50, suggesting weak momentum, which could further lower Bitcoin’s price.
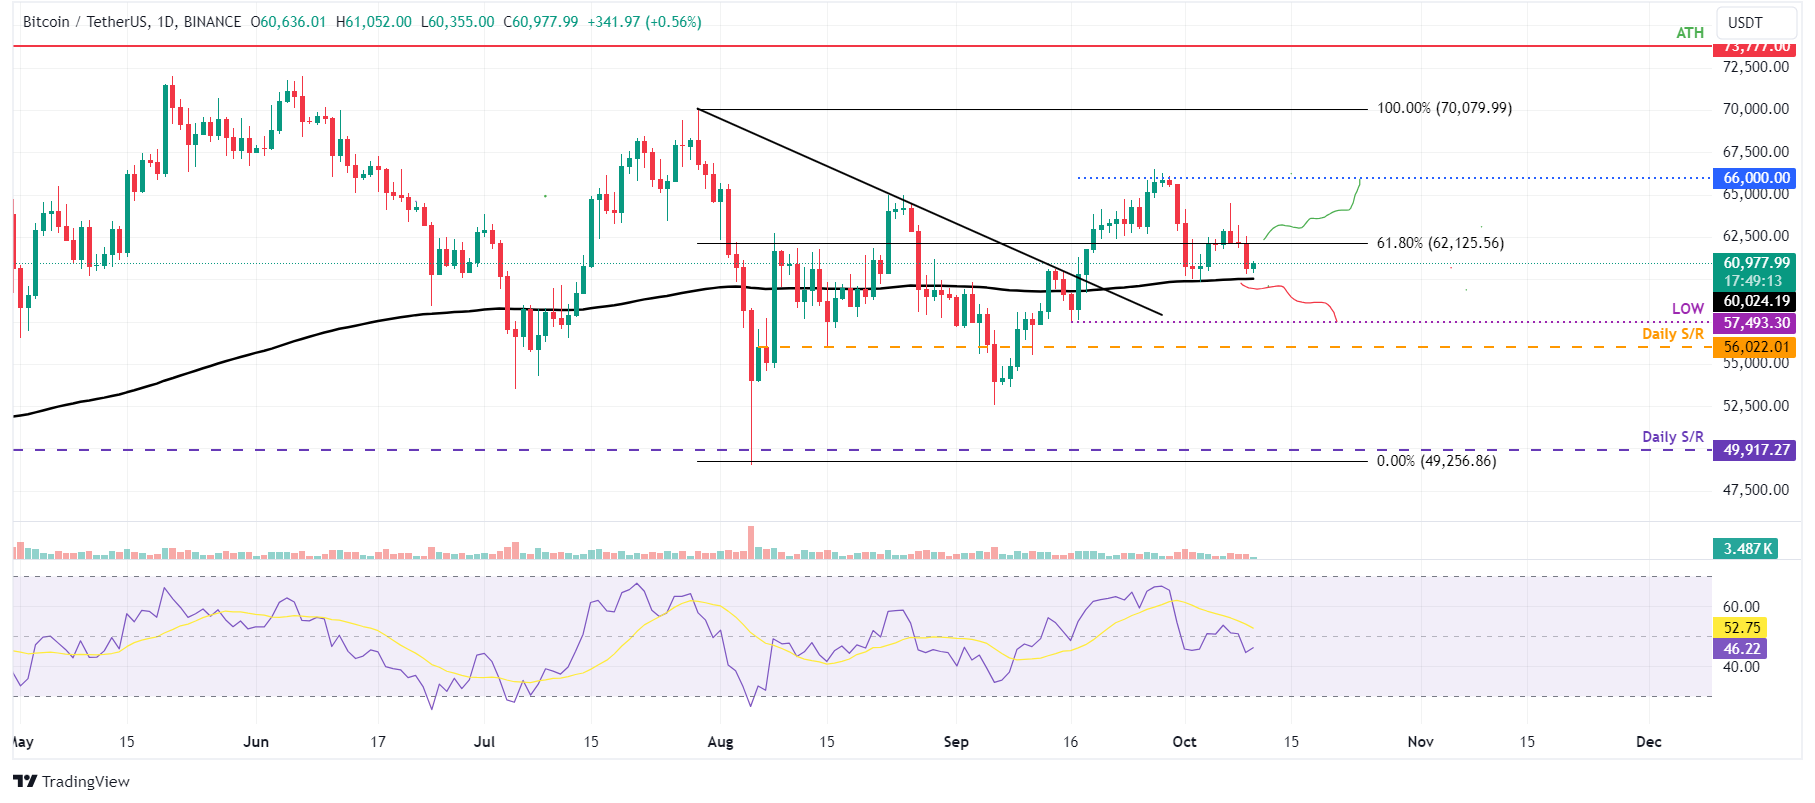
BTC/USDT daily chart
However, the bearish thesis would be invalidated if BTC breaks and closes above $62,125. This scenario could lead to the BTC price rising and retesting its psychologically important $66,000 level.
Bitcoin, altcoins, stablecoins FAQs
Bitcoin is the largest cryptocurrency by market capitalization, a virtual currency designed to serve as money. This form of payment cannot be controlled by any one person, group, or entity, which eliminates the need for third-party participation during financial transactions.
Altcoins are any cryptocurrency apart from Bitcoin, but some also regard Ethereum as a non-altcoin because it is from these two cryptocurrencies that forking happens. If this is true, then Litecoin is the first altcoin, forked from the Bitcoin protocol and, therefore, an “improved” version of it.
Stablecoins are cryptocurrencies designed to have a stable price, with their value backed by a reserve of the asset it represents. To achieve this, the value of any one stablecoin is pegged to a commodity or financial instrument, such as the US Dollar (USD), with its supply regulated by an algorithm or demand. The main goal of stablecoins is to provide an on/off-ramp for investors willing to trade and invest in cryptocurrencies. Stablecoins also allow investors to store value since cryptocurrencies, in general, are subject to volatility.
Bitcoin dominance is the ratio of Bitcoin's market capitalization to the total market capitalization of all cryptocurrencies combined. It provides a clear picture of Bitcoin’s interest among investors. A high BTC dominance typically happens before and during a bull run, in which investors resort to investing in relatively stable and high market capitalization cryptocurrency like Bitcoin. A drop in BTC dominance usually means that investors are moving their capital and/or profits to altcoins in a quest for higher returns, which usually triggers an explosion of altcoin rallies.
Artigos Recomendados


