Can DYDX price overcome two critical hurdles and rally 25%?

Fonte Fxstreet
  • DYDX price approaches the $2.84 resistance, hoping for a breakout.
  • A successful flip into a support floor could trigger a 25% rally to $3.60.
  • A daily candlestick close below $2.58 will invalidate the bullish thesis for DYDX. 

DYDX price is making another comeback that could lead to handsome gains if it is successful. Investors need to watch out for the 12-hour momentum indicators, which clearly signal an imminent explosive upward move for the altcoin. 

Read more: DYDX Price Forecast: dYdX holders likely to witness 20% gains

DYDX price edges closer to breakout

DYDX price created a range, extending from $2.84 to $4.36, as it shed 35% of its value between November 15 and 21. The range low at $2.84 played a key role in supporting the price action up to January 3. But a sudden selling pressure spike back then pushed the altcoin to breach the support floor and flip it into a resistance level.

Since then, DYDX price has been hovering below it for nearly a month, with one failed attempt at a breakout. 

The Relative Strength Index (RSI) has cleared the 50 mean level and is now waiting on the Awesome Oscillator (AO) to do the same. A successful flip of the AO above its mean level will confirm the start of a bull rally. 

Often, the 12-hour time frame is regarded as key by day traders, and they take lower time frame actions based on the signals spotted here. As an example, investors can take a look at the AO flipping above the zero line and its effect on the DYDX price.

On December 22, DYDX price rallied 10% as the AO flipped above the zero line. Similarly, a 13.5% move was spotted between January 14 and 18 as the momentum indicator climbed above the baseline. 

Hence, a similar breakout, if accompanied by a flip of the $2.84 level into a support floor, will add wings to the rally. This move could potentially trigger an extension of the upswing to the aforementioned range’s midpoint at $3.60. However, this upswing needs to overcome the declining resistance level that connects the November 25 and December 27 swing highs. 

In total, this move would constitute a 25% gain from the $2.84 level. 
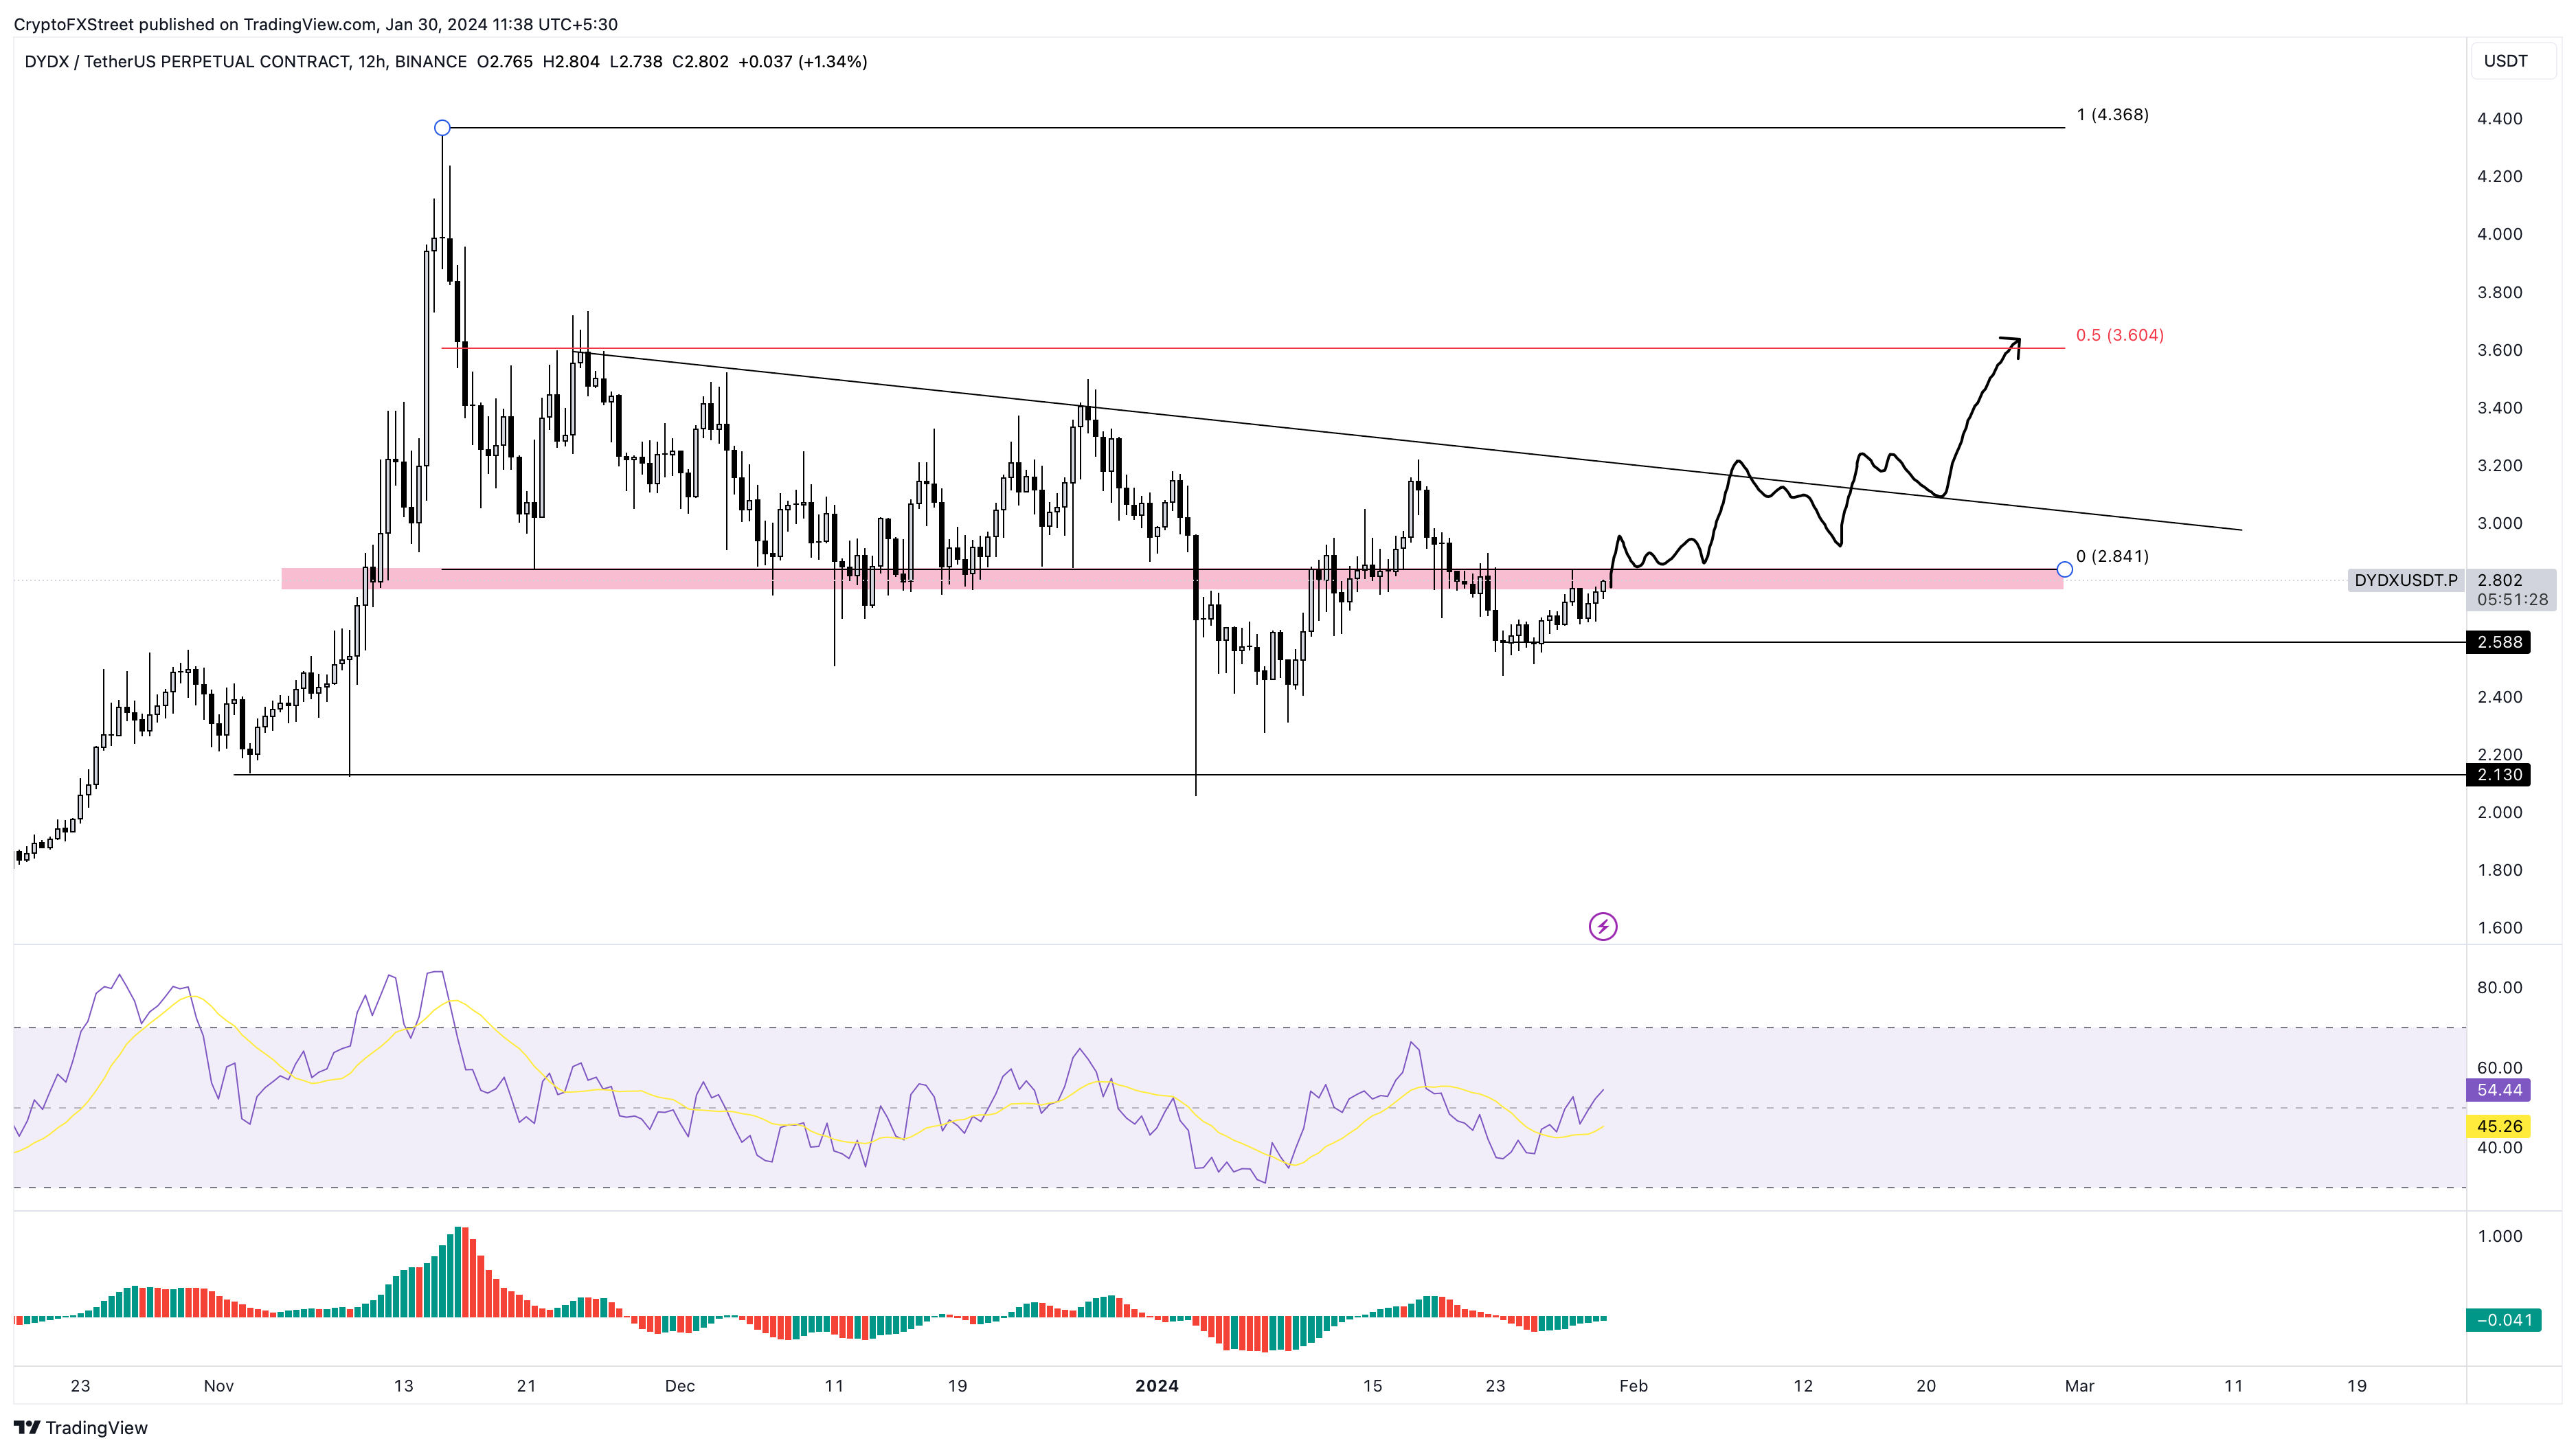
DYDX/USDT 12-hour chart

DYDX/USDT 12-hour chart

On the other hand, if DYDX price fails to overcome the $2.84 hurdle and instead gets rejected, investors should expect a retest of the $2.58 support floor. A daily candlestick close below this level will create a lower low and invalidate the bullish thesis.

Such a development could see DYDX price trigger an 18% correction to the next key foothold at $2.13, especially if the selling pressure fails to cease. 

Also read: Four altcoins most likely to bounce during Christmas holidays: LTC, STORJ, ILV, DYDX

Isenção de responsabilidade: Apenas para fins informativos. O desempenho passado não é indicativo de resultados futuros.
placeholder
O preço do ouro atinge um recorde de alta, com o aumento das tensões geopolíticas em focoO preço do ouro (XAU/USD) ganha impulso na segunda-feira. O metal amarelo atingiu um recorde de alta próximo a US$ 2.441 durante a sessão asiática de segunda-feira, em meio a esperanças renovadas de cortes nas taxas de juros do Federal Reserve (Fed) dos EUA e ao aumento das tensões geopolíticas no Oriente Médio.
Autor  FXStreet
5 Mês 20 Dia Seg
O preço do ouro (XAU/USD) ganha impulso na segunda-feira. O metal amarelo atingiu um recorde de alta próximo a US$ 2.441 durante a sessão asiática de segunda-feira, em meio a esperanças renovadas de cortes nas taxas de juros do Federal Reserve (Fed) dos EUA e ao aumento das tensões geopolíticas no Oriente Médio.
placeholder
Até onde o ouro pode subir este ano? Veja o que diz este especialistaInvesting.com – Com a divulgação dos mais recentes índices de inflação, os investidores do ouro permanecem atentos à direção futura dos preços do metal precioso.Embora a expectativa geral seja de que
Autor  Investing.com
6 Mês 14 Dia Sex
Investing.com – Com a divulgação dos mais recentes índices de inflação, os investidores do ouro permanecem atentos à direção futura dos preços do metal precioso.Embora a expectativa geral seja de que
placeholder
VALE3 Vale a Pena Comprar Ações da VALE? Análise Técnica GráficaNo vídeo "VALE3 Vale a Pena Comprar Ações da VALE? Análise Técnica Gráfica" teremos a oportunidade de ver uma análise técnica / análise gráfica das ações VALE3 e também do minério de ferro negociado na bolsa chinesa.
Autor  Roberto Fernandes
6 Mês 17 Dia Seg
No vídeo "VALE3 Vale a Pena Comprar Ações da VALE? Análise Técnica Gráfica" teremos a oportunidade de ver uma análise técnica / análise gráfica das ações VALE3 e também do minério de ferro negociado na bolsa chinesa.
placeholder
UBS enxerga recuperação das commodities mesmo com receios sobre demandaInvesting.com – Mesmo com receios e incertezas a respeito da demanda global, as commodities devem apresentar tendência de recuperação, disseram especialistas do banco UBS em relatório divulgado a clie
Autor  Investing.com
7 Mês 25 Dia Qui
Investing.com – Mesmo com receios e incertezas a respeito da demanda global, as commodities devem apresentar tendência de recuperação, disseram especialistas do banco UBS em relatório divulgado a clie
placeholder
UBS BB inicia cobertura de Banrisul com indicação neutraInvesting.com – Analistas do UBS BB iniciaram a cobertura das ações do Banrisul (BVMF:BRSR6) com recomendação neutra e preço-alvo de R$14. O tradicional banco regional estaria enfrentando novo desafio
Autor  Investing.com
7 Mês 31 Dia Qua
Investing.com – Analistas do UBS BB iniciaram a cobertura das ações do Banrisul (BVMF:BRSR6) com recomendação neutra e preço-alvo de R$14. O tradicional banco regional estaria enfrentando novo desafio
goTop
quote