Solana announces details of Seeker, second mobile device after Saga phone
- Solana drops details of a second mobile device called Seeker after strong demand for Saga, its first flagship phone.
- The Ethereum-competitor first launched the phone in January and received more thanr 140,000 pre-orders.
- Emmett Hollyer, General Manager at Solana Labs, said that Seeker would be a “rewards magnet” for users.
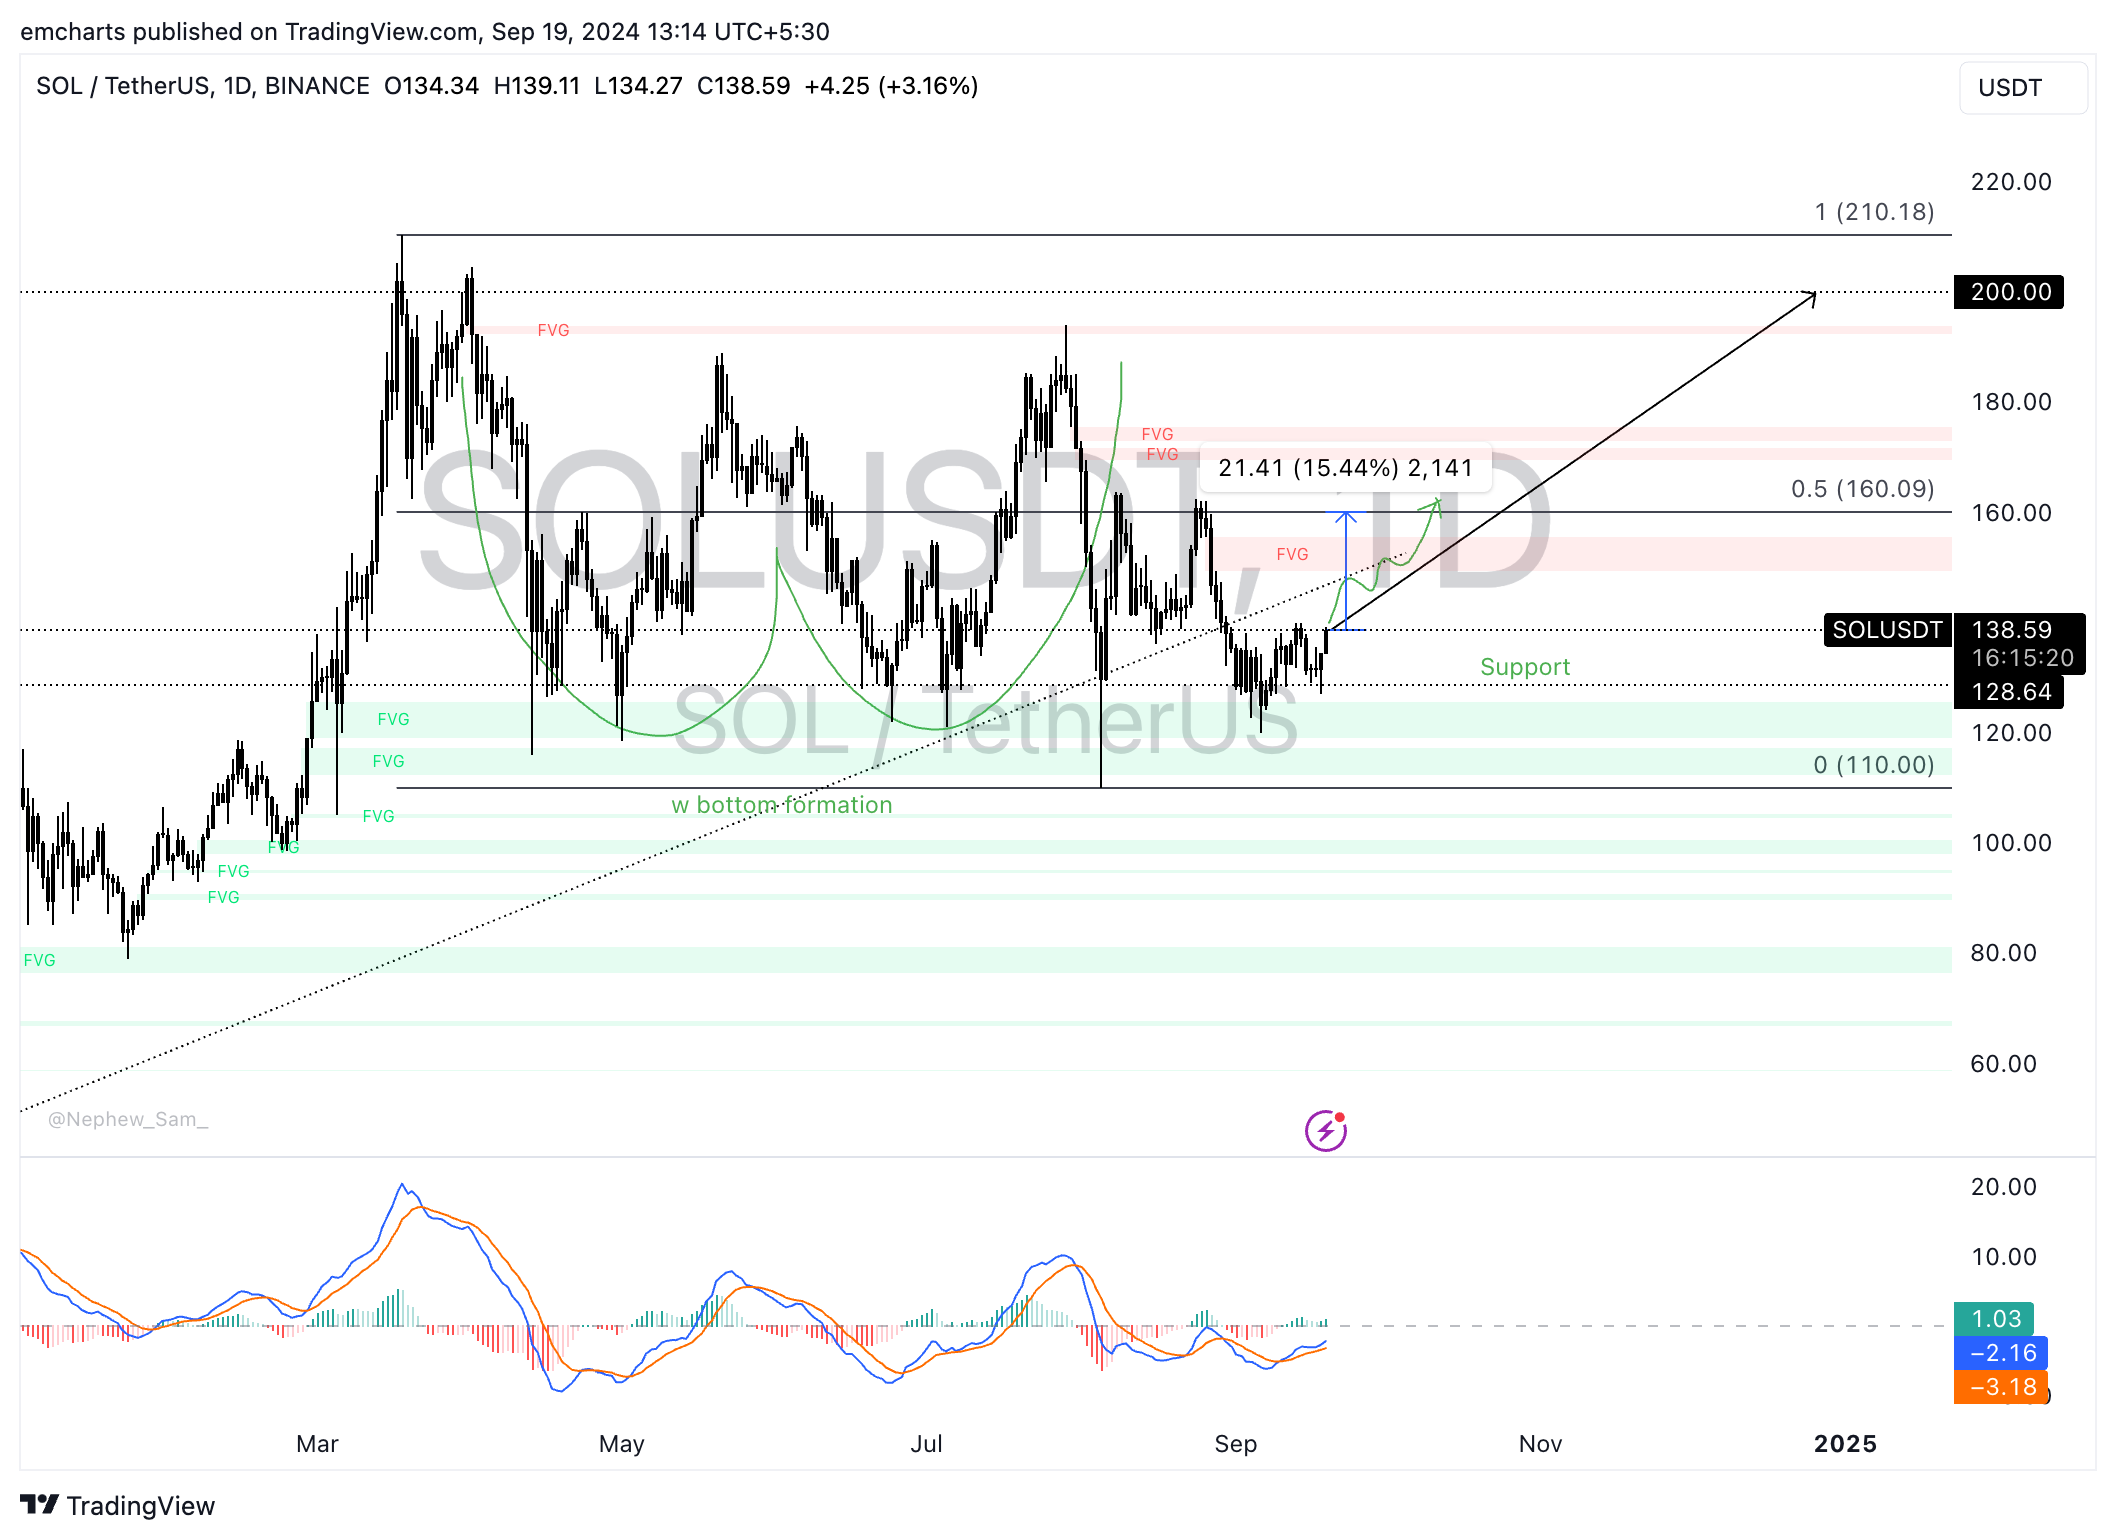
- Solana hovers around $140 on Thursday, eyes $200 target.
Solana Lab’s second phone, Seeker, is set to launch in 2025. At Token2049, a global conference for crypto, Solana’s General Manager Emmett Hollyer said that the new mobile would be a “rewards magnet” for its users. This means buyers can expect rewards like airdrops or exclusive offers on decentralised applications (dApps) that run on the phone.
Solana’s (SOL) price performance so far this year has largely been driven by meme coin token launches on the chain, according to a report from CoinGecko. In this regard, Hollyer said that Seeker wouldn't just be a “meme coin phone.”
The launch of Solana’s first phone, called Saga, on May 8, 2023, pushed SOL price 55% higher within two months. If the pattern repeats, Seeker’s launch could act as a catalyst for gains in Solana.
Solana releases branding, first look of new phone Seeker
Solana holders are awaiting the complete list of hardware specifications for the second mobile device from Solana Labs. During the Token2049 event, the team shared the branding and the first look of Seeker, a mobile that is more than a “meme coin phone” and “assures rewards” to all buyers.
1/ We’ve been deep in build mode for months, and we’re excited to show you what we've been working on.
— Seeker | Solana Mobile (@solanamobile) September 19, 2024
Introducing the next chapter of Solana Mobile: the Solana Seeker pic.twitter.com/2UW3Wqhymw
Seeker has received 140,000 pre-orders since its announcement in January.
The news of the second mobile device is key to Solana since Saga Mobile’s launch in 2023 acted as a catalyst for the asset. The mobile was launched on May 8, 2023, and within two months, SOL rallied nearly 55% to hit a high of $32.13 on July 14, 2023. The surge in demand was largely driven by rewards offered to Saga users, including exclusive decentralized applications (dApps) and meme coin airdrops.
Where is Solana price headed?
Solana has been trading range-bound for several months. The SOL/USDT daily price chart shows that SOL is stuck between the March 18 top of $210.18 and the August 5 low of $110.
The SOL/USDT daily chart shows that price action might have a W pattern formation in the same time frame, which can be interpreted as a double bottom formation. This is considered a bullish technical pattern that could signal a reversal in an asset’s price trend.
In an upside scenario, within the next two to four weeks SOL could target $160, a target that aligns with the 50% Fibonacci retracement of the decline from the March top to the August low. On a longer time frame, a rally to the key resistance level of $200 is likely, particularly if the traditional Santa Clays rally at year end repeatsl.
A rally to $160 would represent a 15.44% increase from current price levels. Before reaching it, however, the altcoin faces resistance in the Fair Value Gap (FVG) extending between $149.30 and $155.53.
The Moving Average Convergence Divergence (MACD), a momentum indicator, flashes green histogram bars above the neutral line, signaling underlying positive momentum in SOL price trend.

SOL/USDT daily chart
In case of a decline, Solana could find first support at $128.64, the September 16 low. Next, the FVG extending between $119 to $125.61 could also hold prices..

