Tron price is set for a decline as technical indicators show bearish momentum

Fonte Fxstreet
  • Tron's RSI indicator forms a bearish divergence, signaling a trend reversal.
  • On-chain data paints a bearish picture, as TRX's long-to-short ratio is below one, and the OI-Weighted Funding rate is negative.
  • A daily candlestick close above $0.170 would invalidate the bearish thesis.


Tron (TRX) retested its resistance barrier and declined 6.1% last week. In the Asian session on Monday, it trades at $0.1557. Tron's price action suggests a decline ahead, as the bearish divergence in technical indicators shows. Furthermore, the on-chain data support the bearish thesis as TRX's long-to-short ratio is below one, and the Oi-Weighted Funding rate is negative.


Tron price is poised for a decline after retesting the resistance barrier


Tron price retested its March 7, 2021, high of $0.170 on August 25  and declined 6.1% last week. On Monday, it trades slightly higher by 0.06% at $0.1557.


Additionally, the formation of a higher high on the daily chart on August 25 contrasts with the Relative Strength Index (RSI) indicator's lower high during the same period. This development is termed a bearish divergence and often leads to the reversal of the trend or a short-term decline.


If the $0.170 level resistance holds, Tron could decline roughly 7% from the current trading level of $0.1557 to retest $0.1425, the previous weekly support.
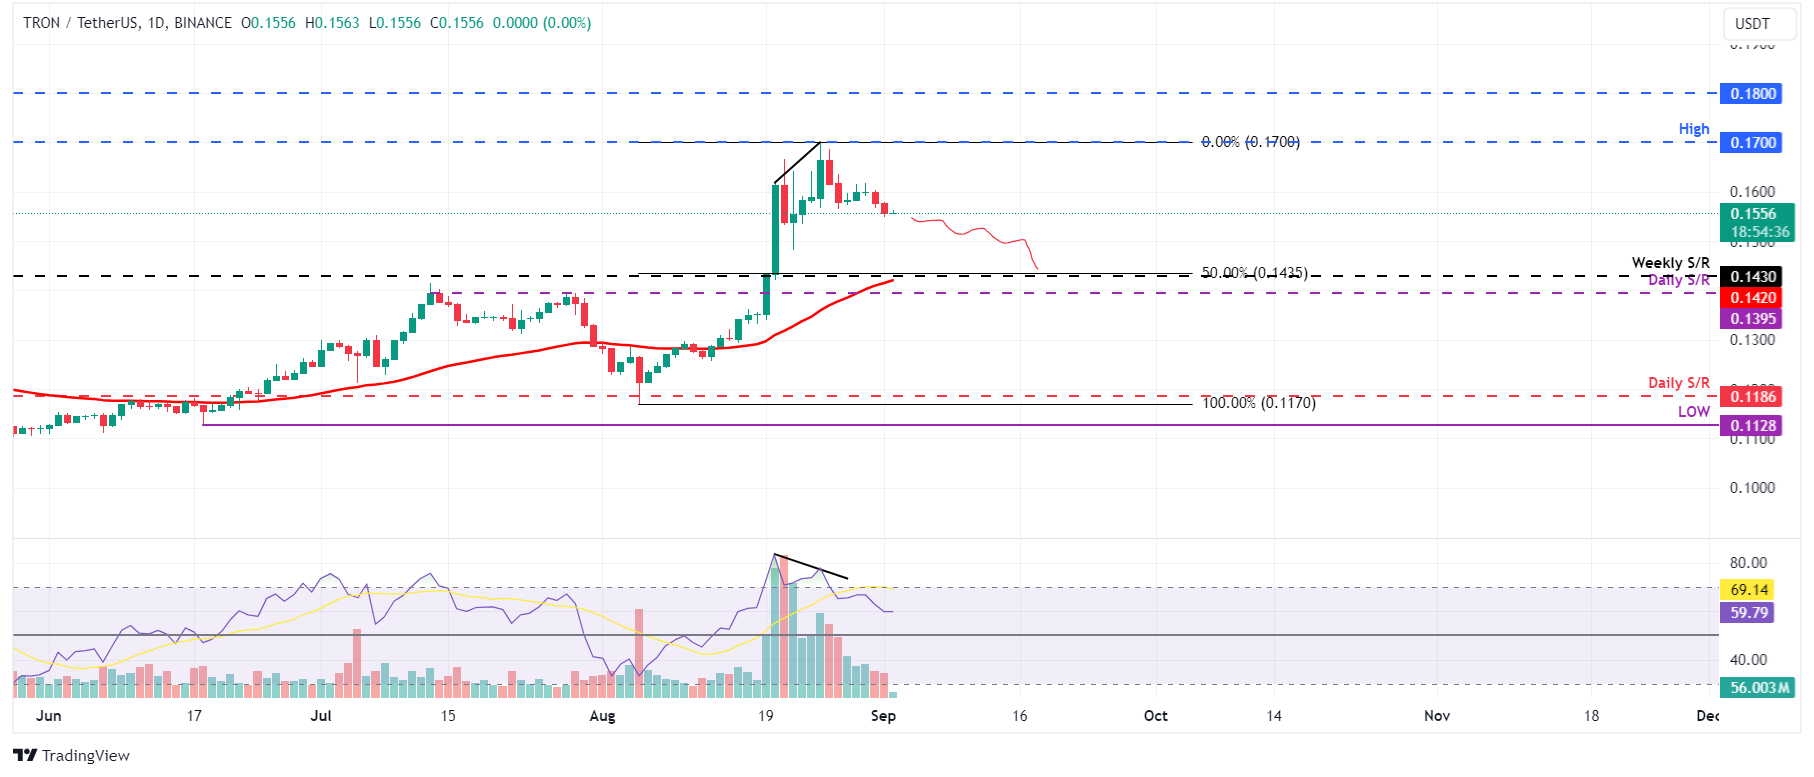
TRX/USDT daily chart

TRX/USDT daily chart


According to Coinglass's OI-Weighted Funding Rate data, it is an important metric for traders and analysts to gauge market sentiment and predict future price movements. This index is based on the yields of futures contracts, which are weighted by their open interest rates. Generally, a positive rate (longs pay shorts) indicates bullish sentiment when long positions pay for shorts. Conversely, negative numbers (shorts pay longs) indicate bearishness, and shorts pay at the expense of longs.


In the case of Tron, this metric stands at -0.033%, reflecting a negative rate and indicating that shorts are paying longs. This scenario often signifies bearish sentiment in the market, suggesting potential downward pressure on Tron's price.

TRX OI-Weighted Funding Rate chart

TRX OI-Weighted Funding Rate chart


Additionally, according to Coinglass's data, Binance TRX's long-to-short ratio stands at 0.43. This ratio reflects bearish sentiment in the market, as the number below one suggests that more traders anticipate the price of the asset to fall, bolstering Tron's bearish outlook.

Tron long-to-short ratio chart

Tron long-to-short ratio chart


However, if TRX's daily candlestick closes above $0.170 and establishes a higher high on the daily timeframe, it may signal a shift in market dynamics that favors bullish sentiment. Such a change could nullify the bearish outlook, leading to a 6% rise in Tron's price to retest the April 17, 2021, high at $0.180.

Isenção de responsabilidade: Apenas para fins informativos. O desempenho passado não é indicativo de resultados futuros.
placeholder
Ethereum (ETH) cai 20% em novembro e testa US$ 3.000; indicador aponta 'zona de compra' históricaO Ether (ETH), token nativo da rede Ethereum, registrou uma queda de quase 20% ao longo do mês de novembro. O ativo saiu da casa dos US$ 3.900 para retestar o nível psicológico de US$ 3.000 no dia 17 de novembro.
Autor  Pedro Augusto Prazeres
11 Mês 19 Dia Qua
O Ether (ETH), token nativo da rede Ethereum, registrou uma queda de quase 20% ao longo do mês de novembro. O ativo saiu da casa dos US$ 3.900 para retestar o nível psicológico de US$ 3.000 no dia 17 de novembro.
placeholder
A Semrush se une à Adobe para impulsionar a próxima geração de marketing generativo com IA.A Adobe adquire a Semrush por US$ 1,9 bilhão, integrando ferramentas de SEO e marketing com inteligência artificial para aumentar a visibilidade da marca em plataformas digitais e baseadas em IA.
Autor  Cryptopolitan
22 horas atrás
A Adobe adquire a Semrush por US$ 1,9 bilhão, integrando ferramentas de SEO e marketing com inteligência artificial para aumentar a visibilidade da marca em plataformas digitais e baseadas em IA.
placeholder
HGLG11 projeta alta na vacância para 2026; RZAK11 paga yield de 1,35% e RZAT11 reduz dividendoO fundo imobiliário CSHG Logística (HGLG11) divulgou seu relatório gerencial referente ao mês de outubro, informando um resultado distribuível de R$ 32,246 milhões. O montante representa um recuo em relação ao desempenho de setembro, quando o fundo havia registrado R$ 36,939 milhões.
Autor  Pedro Augusto Prazeres
21 horas atrás
O fundo imobiliário CSHG Logística (HGLG11) divulgou seu relatório gerencial referente ao mês de outubro, informando um resultado distribuível de R$ 32,246 milhões. O montante representa um recuo em relação ao desempenho de setembro, quando o fundo havia registrado R$ 36,939 milhões.
placeholder
Bitcoin (BTC) cai com ata do Fed; "Medo Extremo" e capitulação podem sinalizar fundoO Bitcoin (BTC) aprofundou sua correção nesta quarta-feira (19), caindo para baixo do patamar de US$ 89.000 e atingindo sua mínima em sete meses. O movimento de aversão ao risco foi intensificado pela divulgação das atas da reunião do Federal Reserve (Fed) realizada em 28 e 29 de outubro.
Autor  Pedro Augusto Prazeres
22 horas atrás
O Bitcoin (BTC) aprofundou sua correção nesta quarta-feira (19), caindo para baixo do patamar de US$ 89.000 e atingindo sua mínima em sete meses. O movimento de aversão ao risco foi intensificado pela divulgação das atas da reunião do Federal Reserve (Fed) realizada em 28 e 29 de outubro.
placeholder
Ibovespa cai antes do feriado; dólar sobe a R$ 5,33 com cautela e queda do petróleoO Ibovespa encerrou esta quarta-feira (19) em queda de 0,73%, aos 155.380,66 pontos, registrando uma perda de mais de 1.100 pontos. O movimento marca a terceira baixa consecutiva do índice, uma sequência negativa que não era vista desde o início de outubro.
Autor  Pedro Augusto Prazeres
21 horas atrás
O Ibovespa encerrou esta quarta-feira (19) em queda de 0,73%, aos 155.380,66 pontos, registrando uma perda de mais de 1.100 pontos. O movimento marca a terceira baixa consecutiva do índice, uma sequência negativa que não era vista desde o início de outubro.
Produtos relacionados
goTop
quote