

Ethereum struggles under $3,000 with eight consecutive days of Ether ETF outflows, what’s next
- Ethereum ETFs have noted eight consecutive days of outflows, signaling decline in institutional demand.
- Layer 2 chains that scale the Ethereum network have negatively influenced the revenue collected by Ether.
- Ether supply turned inflationary, meaning circulating supply is on the rise, likely negatively influencing price.
- ETH struggles under $3,000 resistance level, trading at $2,648 at the time of writing.
Ethereum (ETH) trades at $2,648 early on Tuesday. The second largest cryptocurrency has struggled to break past key resistance at $3,000 as institutional capital flows out of Spot Ethereum ETFs.
Ether ETF approval failed to catalyze gains in the underlying asset, unlike Bitcoin, raising concerns among Ether holders.
Three factors influencing Ethereum price
Ethereum price dipped under key resistance at $3,000 on August 3, since then the altcoin has failed to make a comeback above this level. Ether trades 13% under the $3,000 level, at $2,648, on Tuesday.
Three factors influencing Ether price decline are:
- Ethereum Spot ETF outflows
- Layer 2 chains and their effect on fee revenue
- Rising Ether supply
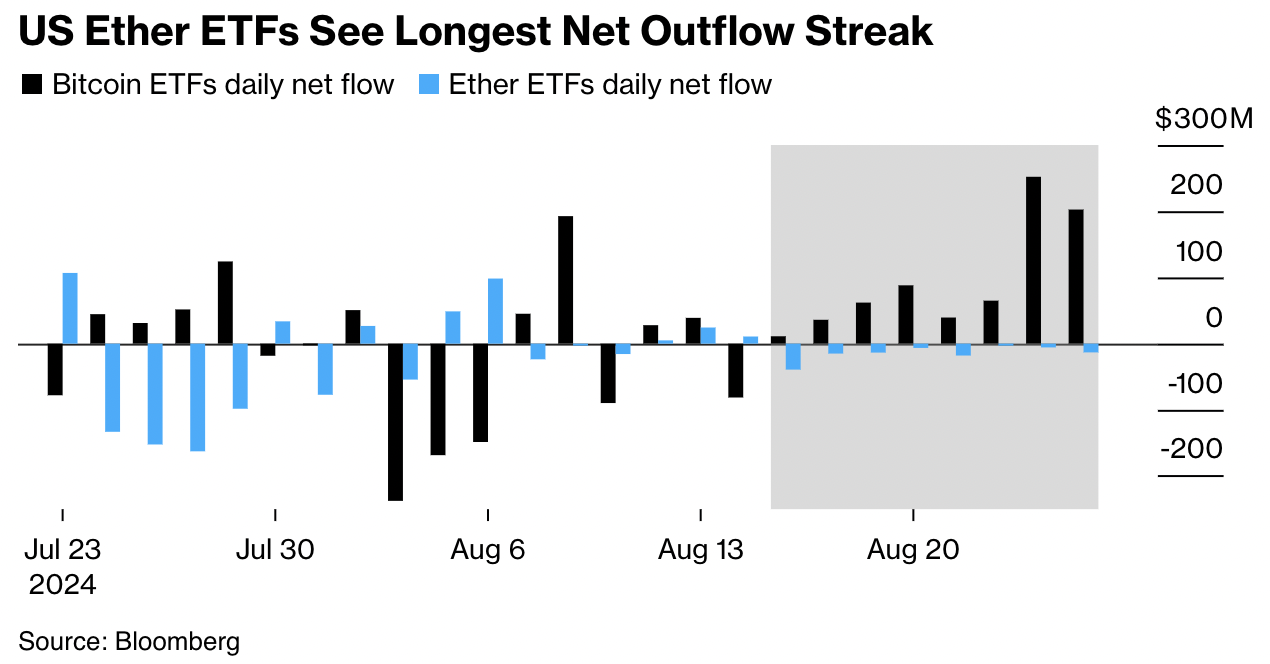
Spot Ethereum ETFs have noted consistent outflows in the last eight days. Data compiled by Bloomberg shows that Spot Ether ETFs launched in July have lost $112 million in institutional capital.
The initial enthusiasm for Ethereum’s deflationary potential has likely waned, per Kraken OTC Director Muneeb Khan. Spot Ether ETF outflows continue to dampen demand for Ether and negatively influence prices.
Ether ETF outflows
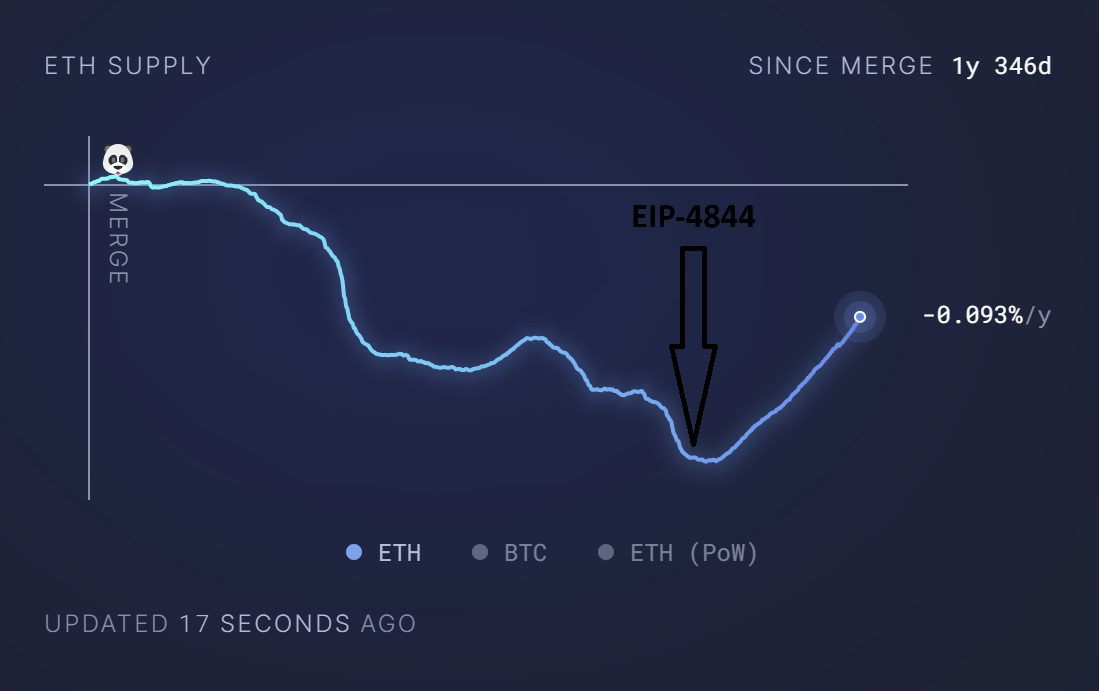
The Ethereum network’s last key upgrade was EIP-4844, also known as proto-danksharding. This reduced the transaction fees for Layer 2 chains and boosted their utility among users. Layer 2 chains have taken a relatively large fraction of transaction fees, reducing the network’s revenue.
This has also influenced the supply of Ether. Since EIP-4844, Ether has turned inflationary again. With lower transaction costs, relatively low volume of ETH is collected as fees and burnt, resulting in a relatively higher circulating supply of the asset than otherwise.
Higher circulating supply typically increases the volume of the asset available across exchanges and user wallets, resulting in higher selling pressure and hampering price gains.
Ethereum supply
Ethereum could slip to $2,500 before recovery
Ethereum has been in a downward trend, the altcoin slipped under the crucial $3,000 level on August 3 and struggles to recover. The altcoin could extend losses by another 3% and collect liquidity at the key support of $2,536, a level that fortified price action throughout this month.
Once Ethereum sweeps liquidity at this level, a recovery is likely. The Relative Strength Index (RSI) reads 42.05, which is below neutral. On the other hand, the Moving Average Convergence Divergence (MACD) indicator shows green histogram bars above the neutral line, so there is underlying positive momentum in Ether.
It is crucial for Ether to sustain above $2,500, another key support this month. A daily candlestick close under this support level could signal further correction in the altcoin. $2,500 coincides with the August 12 low for Ether.
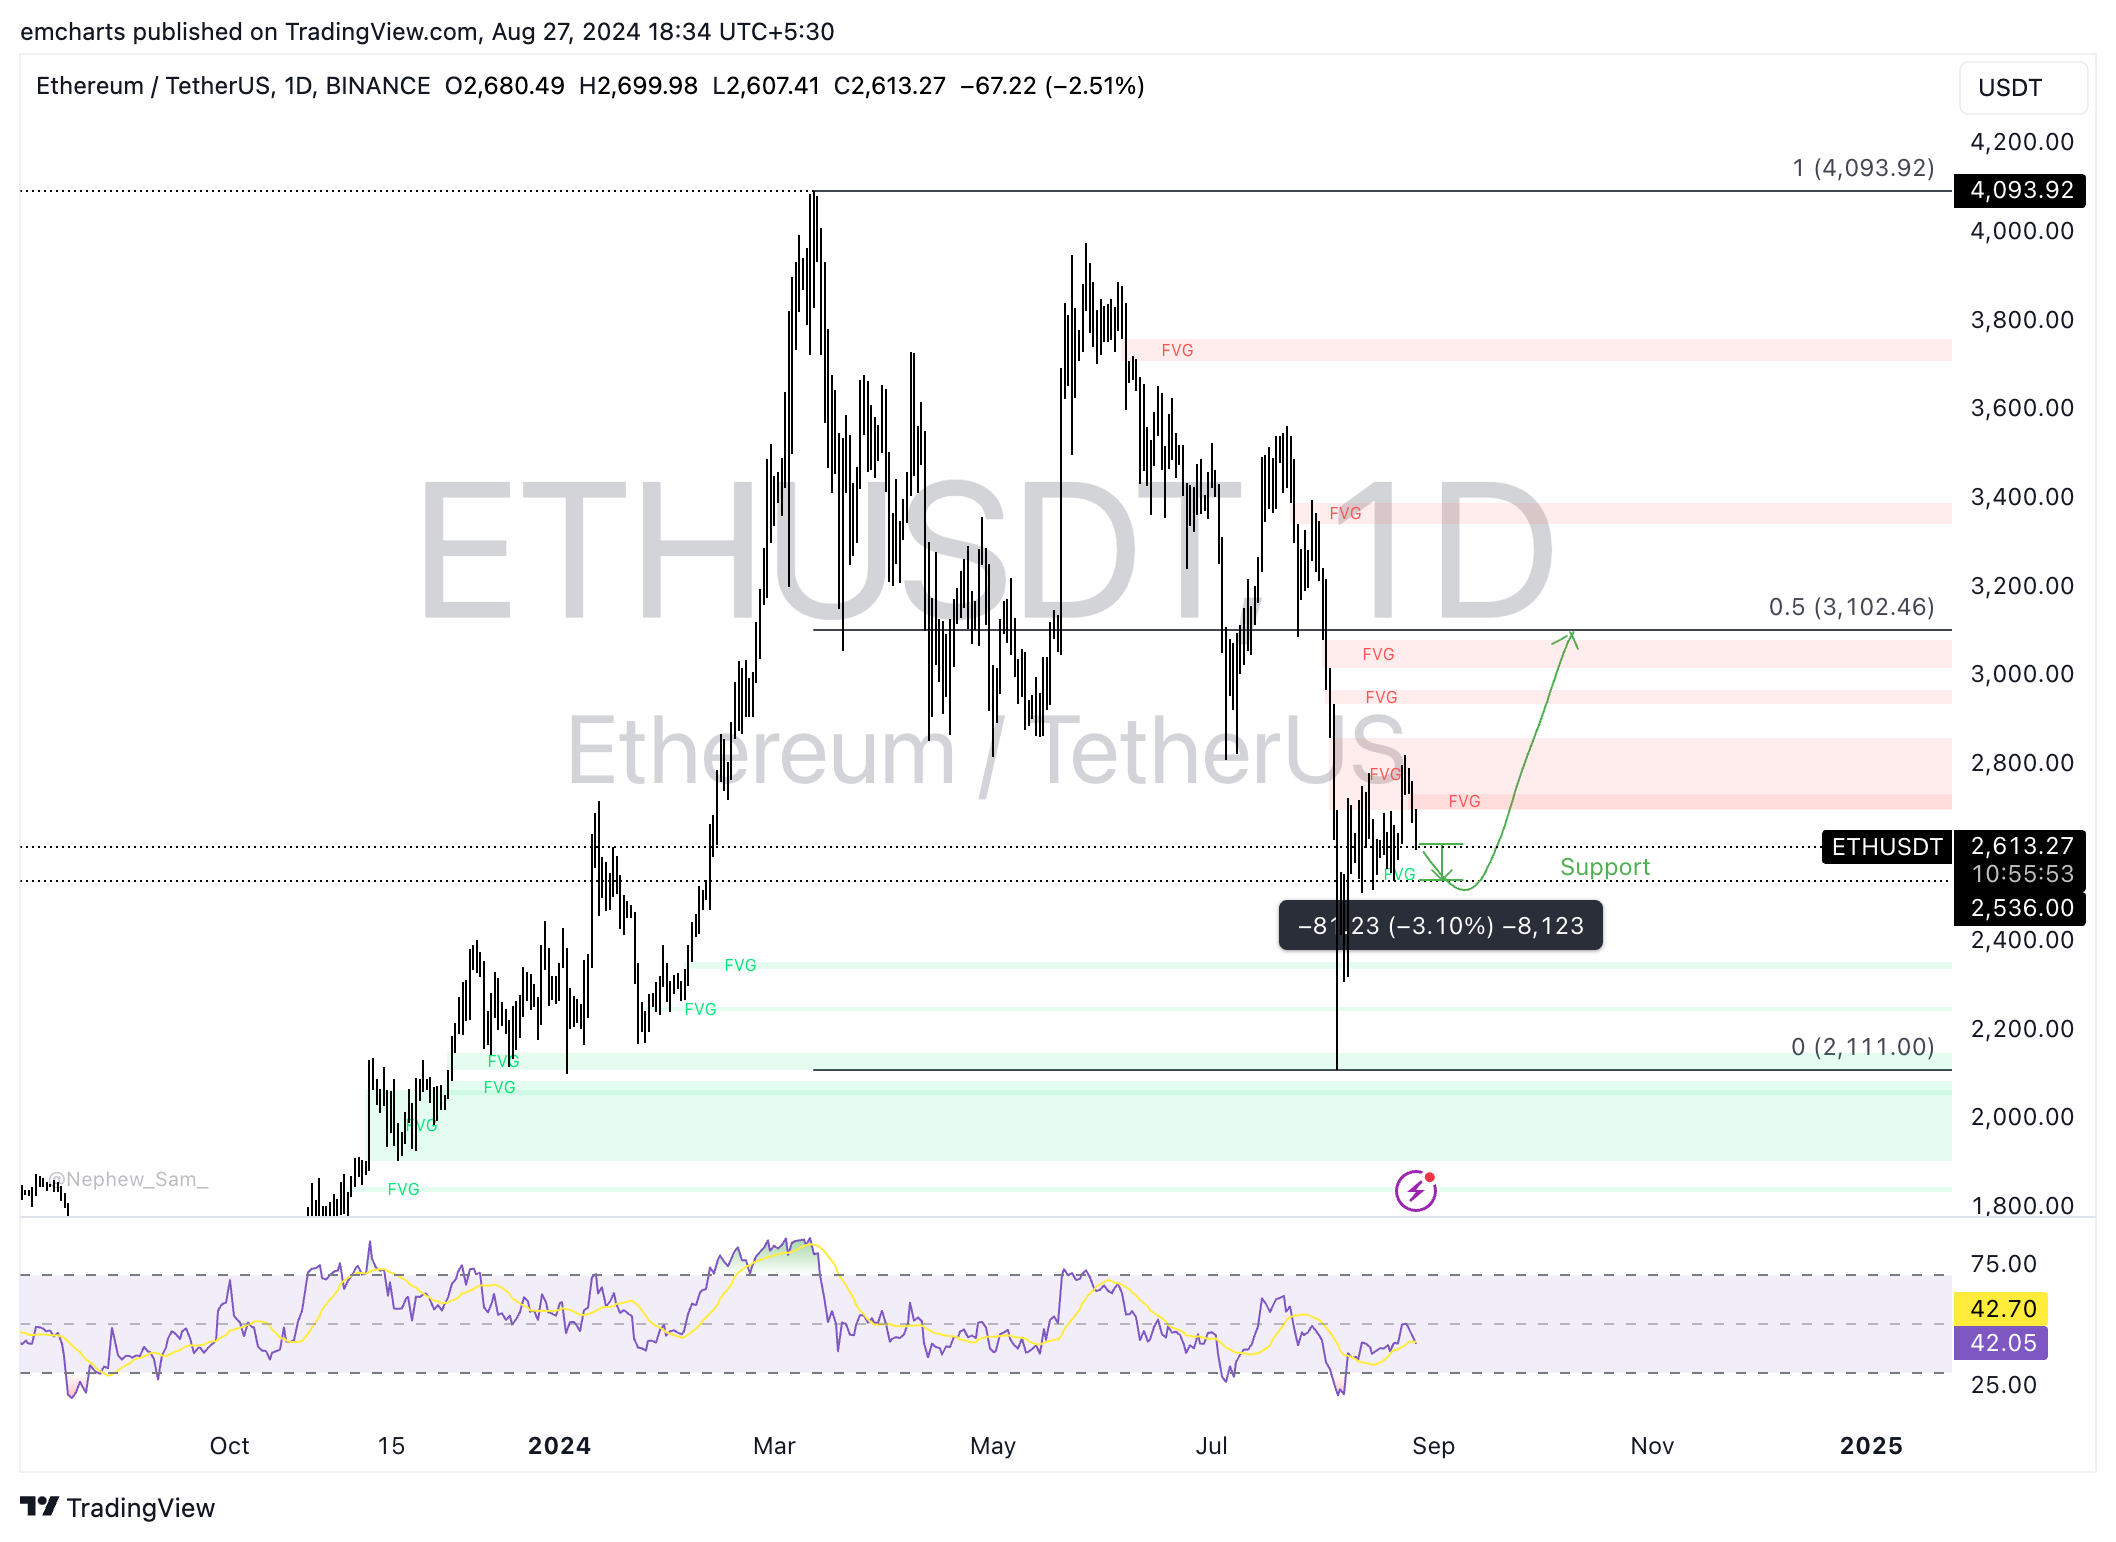
ETH/USDT daily chart
If Ethereum climbs past key resistance at $2,820, the August 24 peak for Ether, it could rally toward the $3,000 level and extend gains to $3,102. This marks the 50% Fibonacci retracement of Ethereum’s decline from its March 12 top of $4,093 to the August 5 low of $2,111.
Ethereum FAQs
Ethereum is a decentralized open-source blockchain with smart contracts functionality. Serving as the basal network for the Ether (ETH) cryptocurrency, it is the second largest crypto and largest altcoin by market capitalization. The Ethereum network is tailored for scalability, programmability, security, and decentralization, attributes that make it popular among developers.
Ethereum uses decentralized blockchain technology, where developers can build and deploy applications that are independent of the central authority. To make this easier, the network has a programming language in place, which helps users create self-executing smart contracts. A smart contract is basically a code that can be verified and allows inter-user transactions.
Staking is a process where investors grow their portfolios by locking their assets for a specified duration instead of selling them. It is used by most blockchains, especially the ones that employ Proof-of-Stake (PoS) mechanism, with users earning rewards as an incentive for committing their tokens. For most long-term cryptocurrency holders, staking is a strategy to make passive income from your assets, putting them to work in exchange for reward generation.
Ethereum transitioned from a Proof-of-Work (PoW) to a Proof-of-Stake (PoS) mechanism in an event christened “The Merge.” The transformation came as the network wanted to achieve more security, cut down on energy consumption by 99.95%, and execute new scaling solutions with a possible threshold of 100,000 transactions per second. With PoS, there are less entry barriers for miners considering the reduced energy demands.
Artigos Recomendados


