
Ripple holders realized nearly $20 million in losses in past ten days, XRP sustains above $0.52
- Ripple holders shed their XRP holdings and took $20 million in profits since May 18.
- XRP social dominance is nearly at the same level, at 1.46%.
- XRP sustained above $0.52 on Tuesday but is down 1% on the day.
Ripple (XRP) holders have consistently realized losses on their XRP holdings on several occasions between May 18 and 28, as seen on the crypto intelligence tracker Santiment. The altcoin’s social dominance remains nearly unchanged, signaling XRP’s relevance among market participants.
XRP holders await further developments in the Securities and Exchange Commission (SEC) vs. Ripple lawsuit.
Daily Digest Market Movers: Ripple holders take losses to the tune of $20 million
- The on-chain metric Network Realized Profit/Loss, used to identify the net profit/loss realized by holders of an asset on a given day, shows that XRP holders realized nearly $20 million in losses in the past ten days.
- Realization of losses on their XRP holdings, to the tune of $20 million, could amount to capitulation. This would mean the altcoin’s price could recover and break past consolidation. XRP price could resume its rally as holders continue to take losses.
 [08.50.25, 28 May, 2024]-638524720780940726.png)
XRP price and Network Realized Profit/Loss
- Social dominance, a metric used to identify XRP’s share among discussions on crypto, has been nearly unchanged in the past ten days. The metric reads 1.46% on May 19 and 1.51% on May 28 at the time of writing.
 [08.52.19, 28 May, 2024]-638524720344538309.png)
XRP price and social dominance
Ripple holders await ruling in the SEC vs. Ripple lawsuit. The legal battle has dragged on since 2020, with the regulator dropping charges against executives Brad Garlinghouse and Chris Larsen, while asking for $2 billion in fines for unregistered securities sale.
Technical analysis: XRP eyes nearly 7% gains
Ripple is in an uptrend that started on April 18. Since then the altcoin has formed higher highs and higher lows consistently. XRP is attempting to flip the $0.5310 resistance level to support. This level is important since it marks the 50% Fibonacci retracement of the decline from the April 9 peak of $0.6431 to the April 13 low of $0.4188.
In its uptrend, XRP could extend gains by nearly 7% and tag $0.5703, the high on the May 6 and April 22 candlestick on the XRP/USDT 1-day chart.
The Moving Average Convergence Divergence indicator with its green histogram bars above the neutral line, supports gains in XRP. It implies there is an underlying positive momentum.
The momentum indicator Relative Strength Index (RSI) reads 50.23, above the neutral level, suggesting bullish momentum in the altcoin.
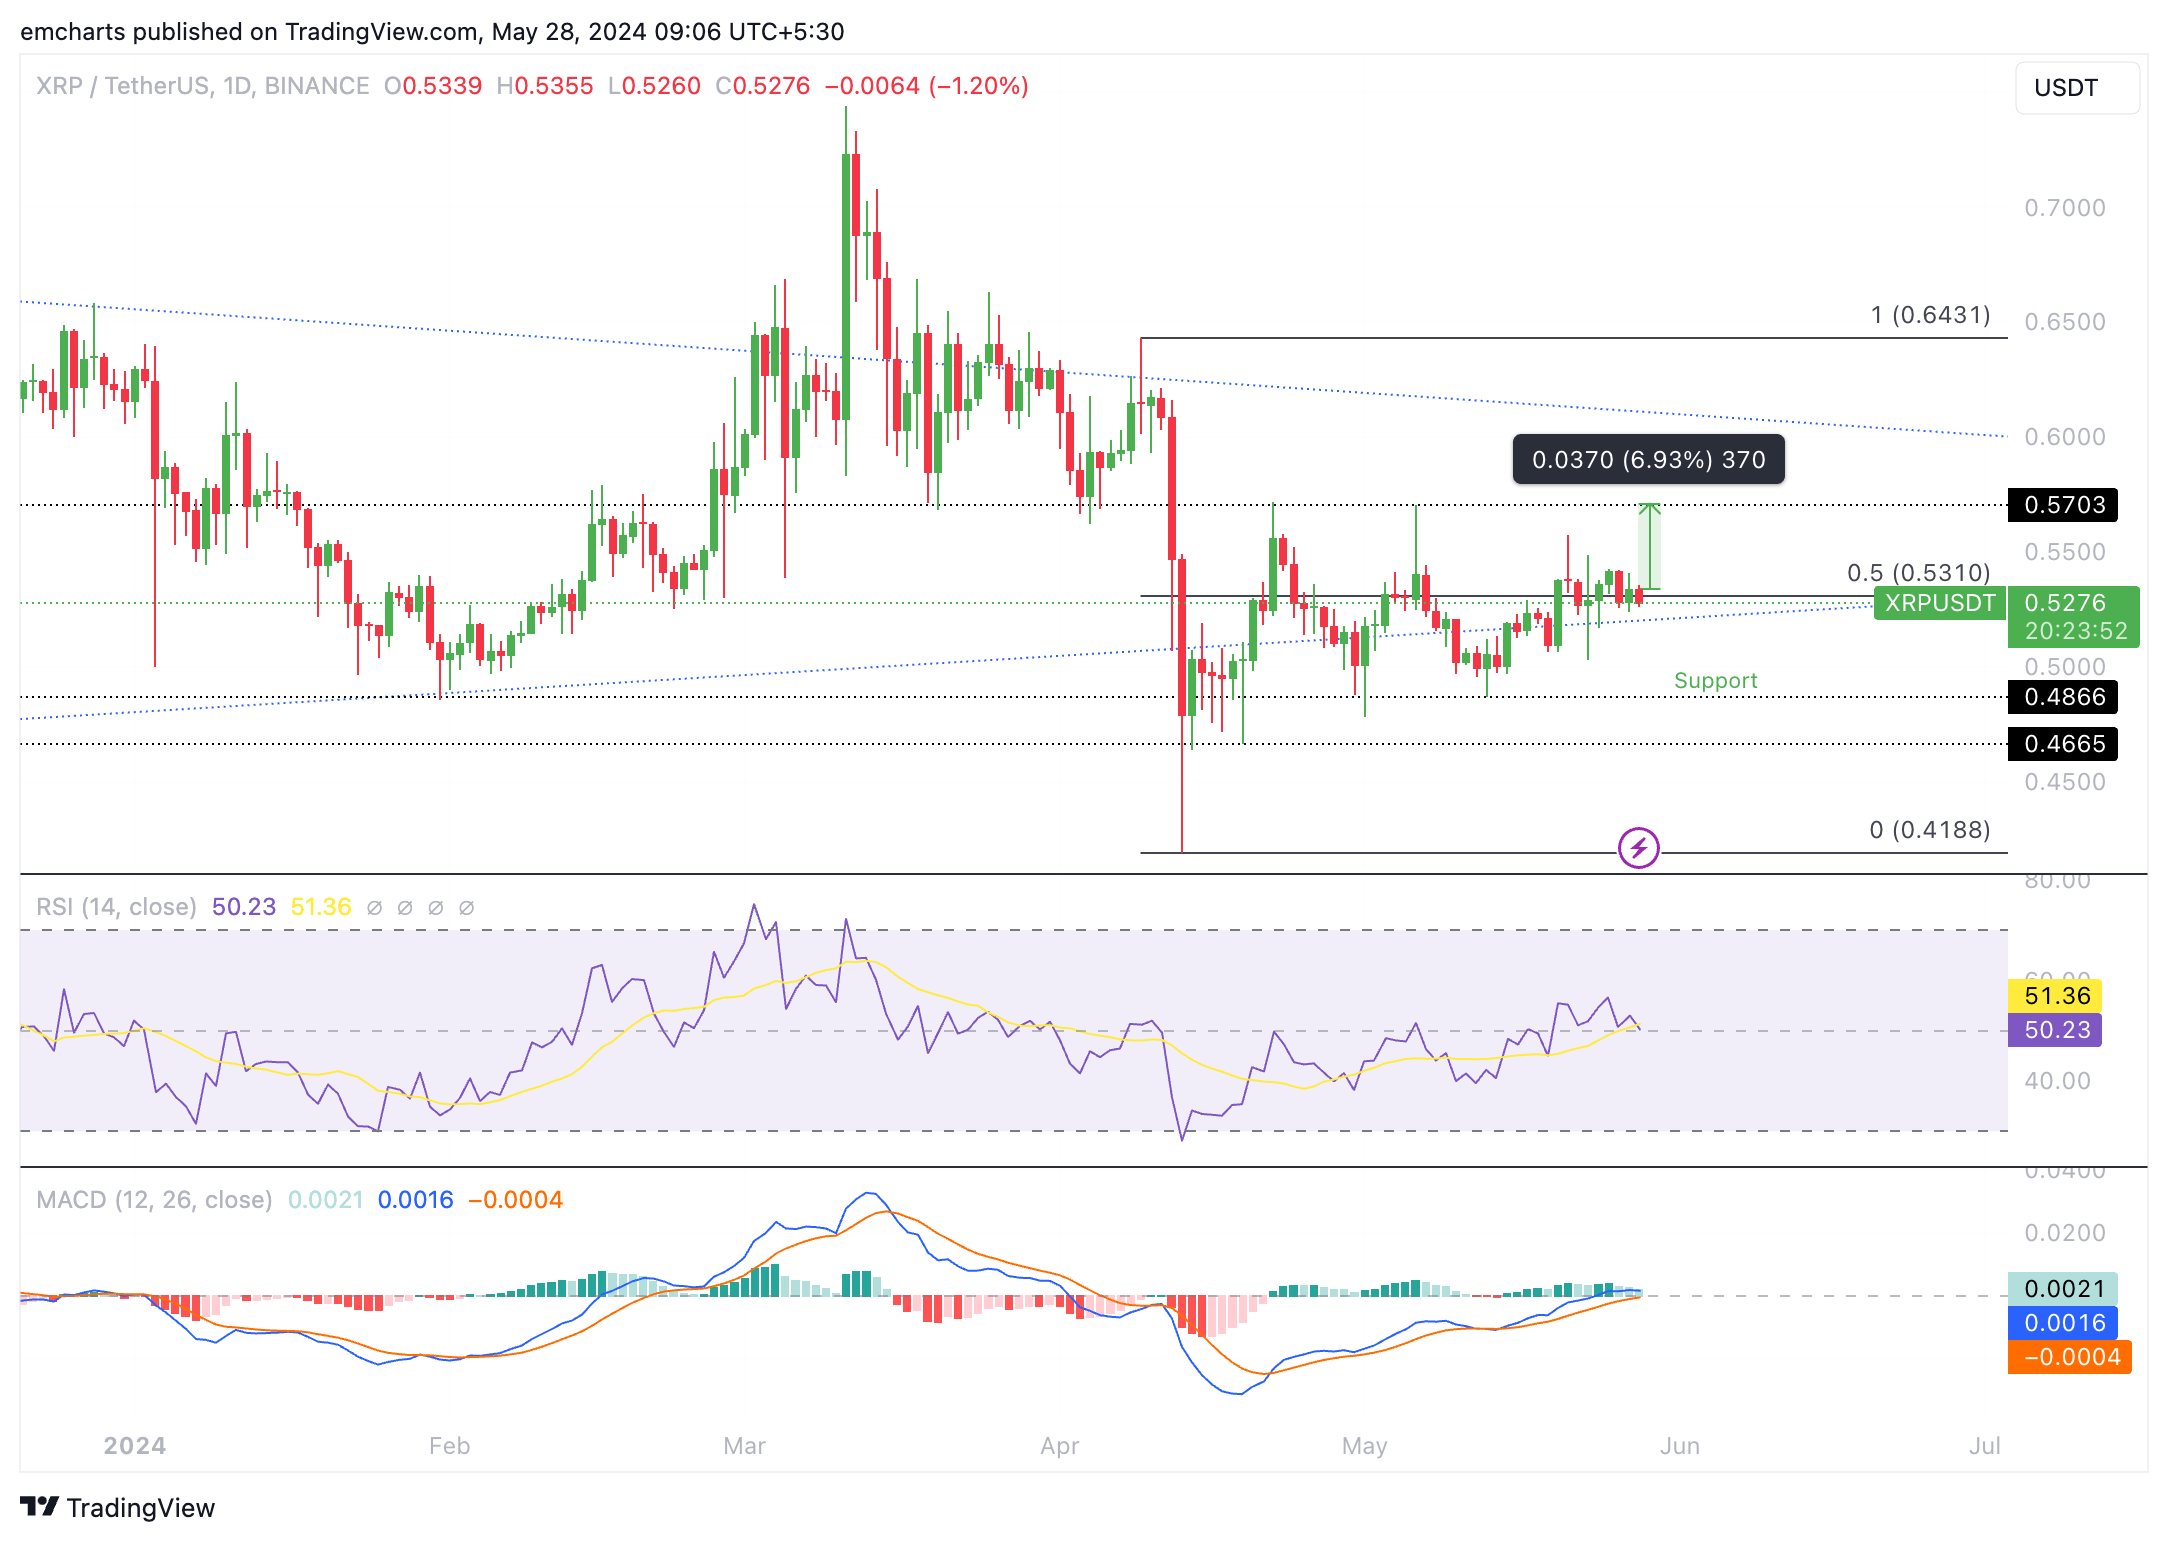
XRP/USDT 1-day chart
In the event of a correction, XRP could sweep liquidity at the May 23 low of $0.5027 and find support at $0.4866, a level that has acted as support for over a month.
Bitcoin, altcoins, stablecoins FAQs
Bitcoin is the largest cryptocurrency by market capitalization, a virtual currency designed to serve as money. This form of payment cannot be controlled by any one person, group, or entity, which eliminates the need for third-party participation during financial transactions.
Altcoins are any cryptocurrency apart from Bitcoin, but some also regard Ethereum as a non-altcoin because it is from these two cryptocurrencies that forking happens. If this is true, then Litecoin is the first altcoin, forked from the Bitcoin protocol and, therefore, an “improved” version of it.
Stablecoins are cryptocurrencies designed to have a stable price, with their value backed by a reserve of the asset it represents. To achieve this, the value of any one stablecoin is pegged to a commodity or financial instrument, such as the US Dollar (USD), with its supply regulated by an algorithm or demand. The main goal of stablecoins is to provide an on/off-ramp for investors willing to trade and invest in cryptocurrencies. Stablecoins also allow investors to store value since cryptocurrencies, in general, are subject to volatility.
Bitcoin dominance is the ratio of Bitcoin's market capitalization to the total market capitalization of all cryptocurrencies combined. It provides a clear picture of Bitcoin’s interest among investors. A high BTC dominance typically happens before and during a bull run, in which investors resort to investing in relatively stable and high market capitalization cryptocurrency like Bitcoin. A drop in BTC dominance usually means that investors are moving their capital and/or profits to altcoins in a quest for higher returns, which usually triggers an explosion of altcoin rallies.
Artigos Recomendados


