

Gold Price Forecast: XAU/USD jumps to near $2,650 as investors consider Trump’s impact on global economy
- Gold price gains to near $2,650 as investors expect heightened global uncertainty under Trump’s administration.
- US Trump is expected to raise import tariffs and lower taxes after joining the White House.
- The US Dollar refreshes two-year higher on lower Initial Jobless Claims in the week ending Dec 27.
Gold price (XAU/USD) extends intraday gains to near $2,650 in the opening North American session on Thursday after the New Year holiday. The precious metal strengthens as its safe-haven appeal as improved, with investors focusing on President-elect Donald Trump taking administration on January 20.
Expected incoming policies from Trump, such as higher import tariffs and lower taxes, will be beneficiaries of the Gold. Higher import tariffs would lead to a potential global trade war and lower taxes will boost inflationary pressures in the United States (US). Gold tends to perform better amid economic uncertainty as a safe-haven bet and higher price pressures, given that investors use the precious metal as a hedge against inflation.
10-year US Treasury yields decline to near 4.54% at the start of the year as the rally stalls. Generally, lower yields on interest-bearing assets result in lower opportunity costs for non-yielding assets, such as Gold, and make them an attractive bet.
Meanwhile, the US Dollar (USD) also gains sharply as investors expect high inflation under Trump’s administration will force the Federal reserve (Fed) to adopt a moderate policy-easing approach. The US Dollar Index (DXY), which tracks the Greenback’s value against six major currencies, posts a fresh two-year high at 108.90.
On the economic front, fewer US Initial Jobless Claims for the week ending December 27 have also strengthened the US Dollar. The Department of Labour reported that individuals claiming jobless benefits for the first time were 211K, lower than estimates of 222K and the former release of 220K.
Gold technical analysis
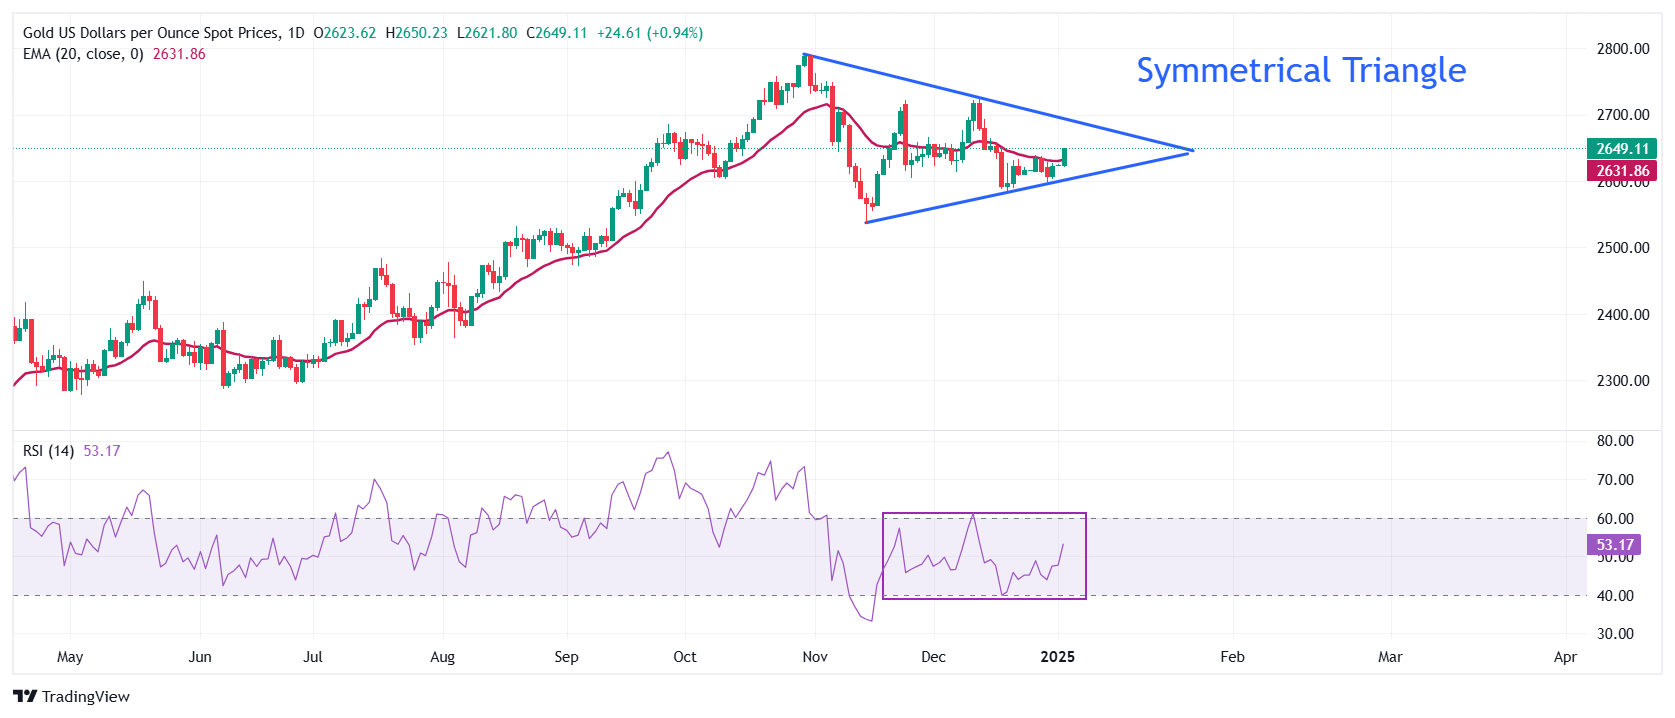
Gold price trades in a Symmetrical Triangle chart formation on a daily timeframe, which exhibits a sharp volatility contraction. The 20-day Exponential Moving Average (EMA) near $2,630 broadly overlaps Gold’s price, suggesting a sideways trend.
The Relative Strength Index (RSI) oscillates in the 40.00-60.00 range, indicating indecisiveness among market participants.
Looking up, the Gold price would strengthen after a decisive break above the December high of $2,726.00. On the contrary, bears would strengthen if the asset breaks below the November low around $2,537.00.
Gold daily chart
Gold FAQs
Gold has played a key role in human’s history as it has been widely used as a store of value and medium of exchange. Currently, apart from its shine and usage for jewelry, the precious metal is widely seen as a safe-haven asset, meaning that it is considered a good investment during turbulent times. Gold is also widely seen as a hedge against inflation and against depreciating currencies as it doesn’t rely on any specific issuer or government.
Central banks are the biggest Gold holders. In their aim to support their currencies in turbulent times, central banks tend to diversify their reserves and buy Gold to improve the perceived strength of the economy and the currency. High Gold reserves can be a source of trust for a country’s solvency. Central banks added 1,136 tonnes of Gold worth around $70 billion to their reserves in 2022, according to data from the World Gold Council. This is the highest yearly purchase since records began. Central banks from emerging economies such as China, India and Turkey are quickly increasing their Gold reserves.
Gold has an inverse correlation with the US Dollar and US Treasuries, which are both major reserve and safe-haven assets. When the Dollar depreciates, Gold tends to rise, enabling investors and central banks to diversify their assets in turbulent times. Gold is also inversely correlated with risk assets. A rally in the stock market tends to weaken Gold price, while sell-offs in riskier markets tend to favor the precious metal.
The price can move due to a wide range of factors. Geopolitical instability or fears of a deep recession can quickly make Gold price escalate due to its safe-haven status. As a yield-less asset, Gold tends to rise with lower interest rates, while higher cost of money usually weighs down on the yellow metal. Still, most moves depend on how the US Dollar (USD) behaves as the asset is priced in dollars (XAU/USD). A strong Dollar tends to keep the price of Gold controlled, whereas a weaker Dollar is likely to push Gold prices up.
Artigos Recomendados


