

Gold recovers ground on geopolitical risks but upside capped by Powell
- Gold is recovering on Tuesday as safe-haven demand increases following Israel’s invasion of Lebanon.
- Fed Chairman Powell adopts a more cautious, data-dependent stance, which caps gains for the yellow metal.
- Technically, XAU/USD is at risk of reversing its short-term uptrend and pushing lower.
Gold (XAU/USD) recovers marginally to trade in the $2,640s per troy ounce on Tuesday after the Israeli army mounts a ground invasion of Lebanon, stoking geopolitical tensions and increasing safe-haven demand for Gold. This, and the fading effect of China’s stimulus program, which temporarily diverted capital back into property and rallying Chinese equity markets, combine to help the yellow metal recover after two consecutive days of losses.
Gold may see upside limited by Fed commentary
Gold will probably see upside capped, however, by comments from the Federal Reserve (Fed) Chairman Jerome Powell, who said on Monday that although the Fed made a larger-than-standard 50 basis points (bps) (0.50%) cut to interest rates at its last meeting, that did not automatically imply the same would happen at future meetings.
Powell said the FOMC is “not a committee that feels like it is in a hurry to cut rates quickly,” during his speech at the NABE conference. The Fed Chairman inferred that the Fed would probably make two more 25 bps cuts to interest rates before the year-end, but that it was not on a “pre-set course.”
The market-based probabilities of the Fed reducing interest rates by 50 bps at its November meeting have fallen from over 60% last week to the mid-30% level on Tuesday, according to the CME FedWatch tool.
Apart from Powell’s comments, stronger-than-expected data has also reduced bets of another “jumbo” rate cut. The decline in chances of a larger cut has weighed on Gold, which is negatively correlated to interest rates. The yellow metal is a non-interest-bearing asset, so when interest rates are lower, it becomes more attractive to investors, and vice versa if rates remain high or rise.
Technical Analysis: Gold correction threatens to reverse short-term uptrend
Gold pulls back to the 50-period Simple Moving Average (SMA) at the 4-hour chart. The correction has unfolded a sequence of lower lows and lower highs since the September 26 all-time high and brings into doubt the precious metal’s short-term uptrend.
The market is quite balanced, but more weakness could possibly follow, bringing Gold down to the trendline at about $2,615-$2,620. A break below the $2,625 Monday’s low would provide bearish confirmation of such a move.
XAU/USD 4-hour Chart
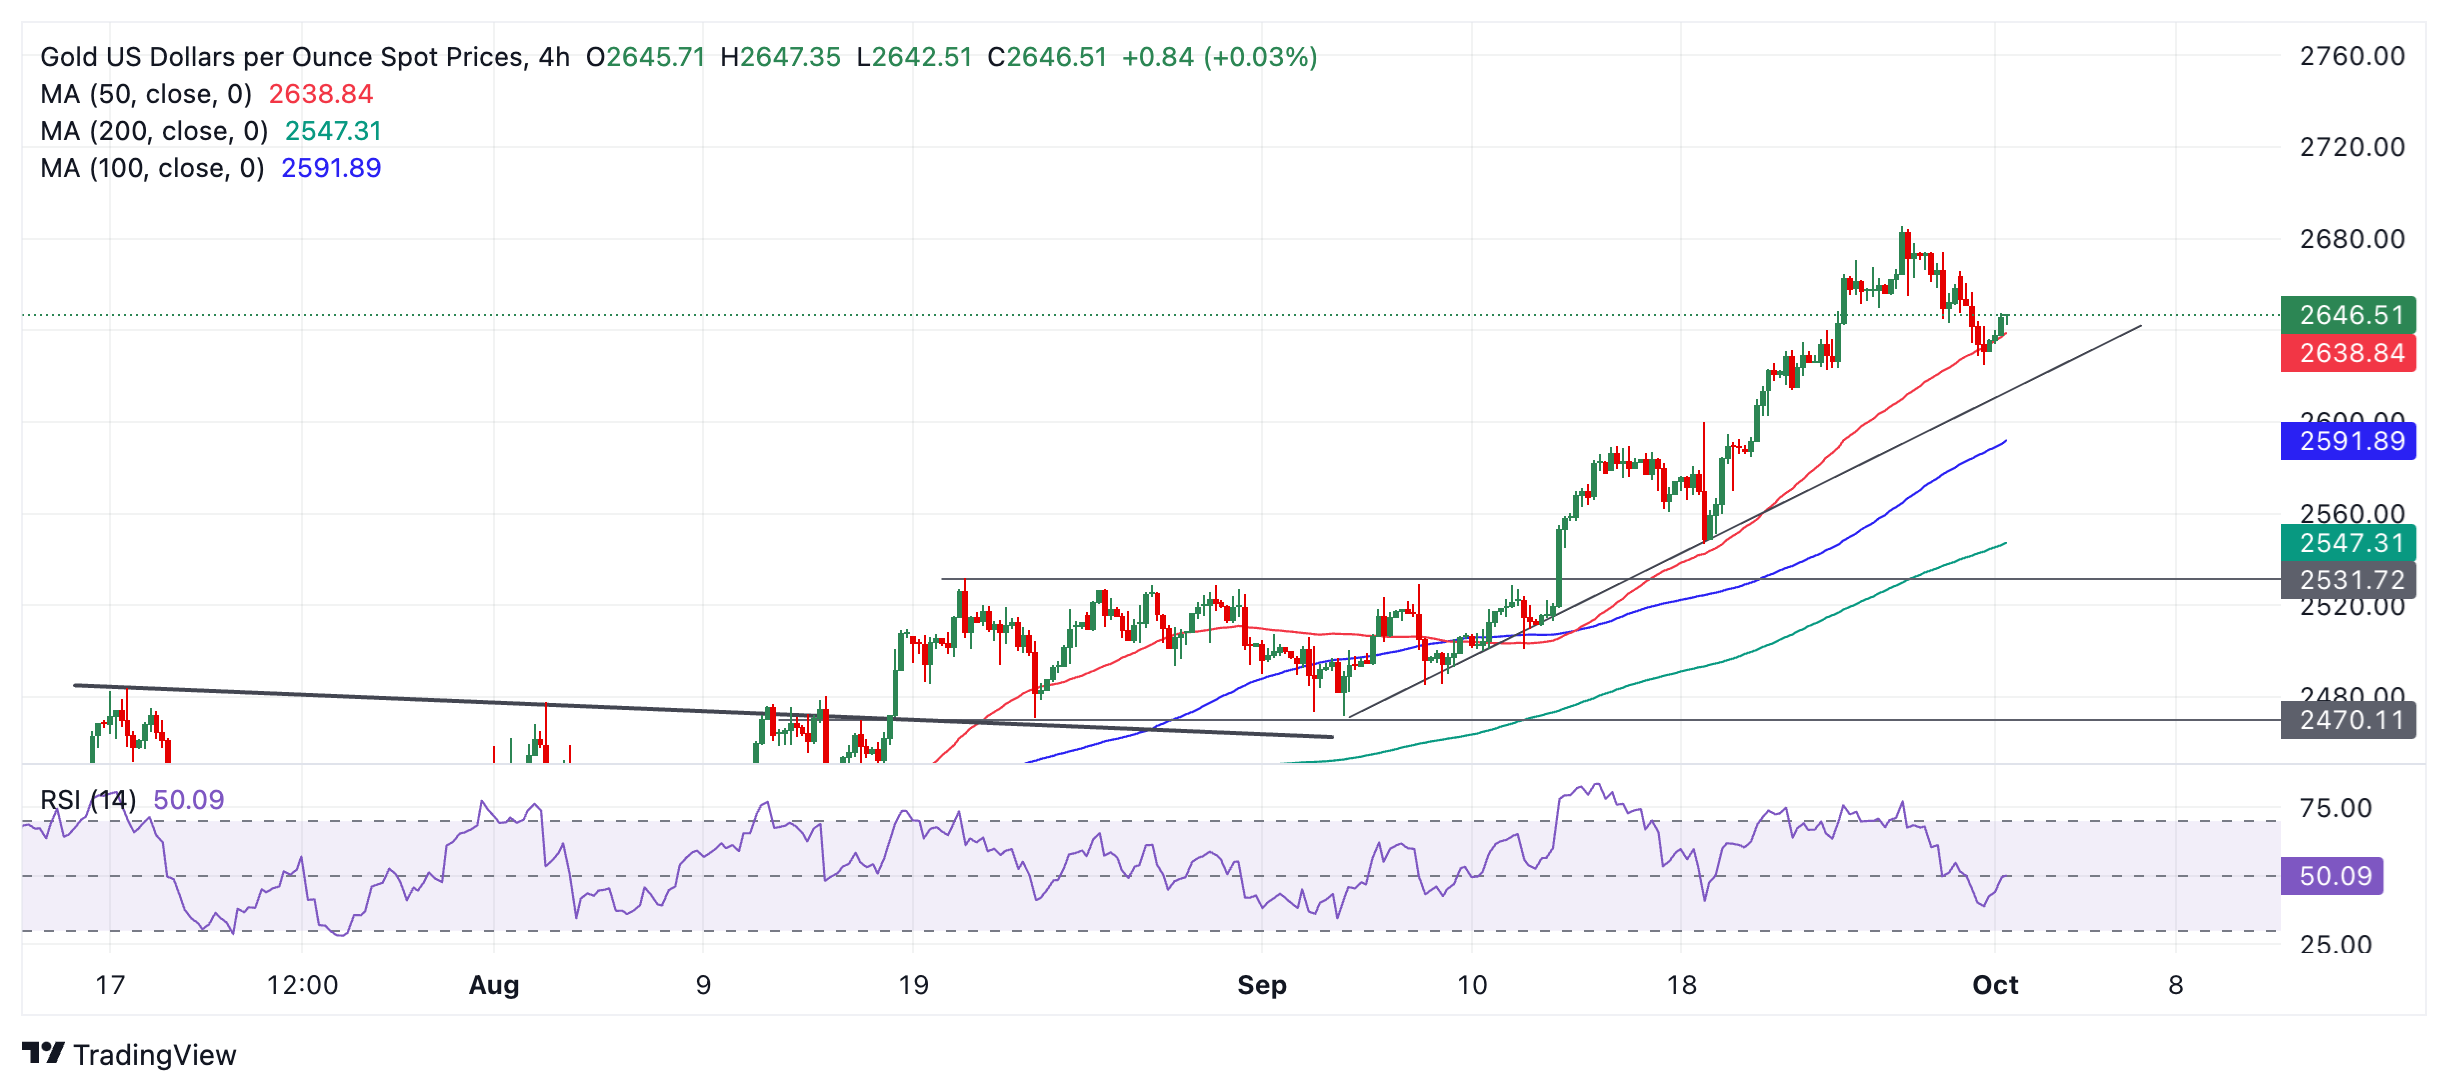
A break below the trendline could lead to yet further weakness until firm support is reached at $2,600 (September 18 high), followed by $2,550 and then $2,544 (0.382 Fibonacci retracement of the September rally).
The Relative Strength Index (RSI) momentum indicator is in neutral territory, further suggesting ample downside space before it becomes oversold.
On a medium and long-term basis, Gold remains in an uptrend, however, and since it is a foundational principle of technical analysis that “the trend is your friend,” the odds favor resumption higher eventually. A break above the $2,685 all-time high would confirm a bullish continuation to round-number targets at $2,700 and then $2,750.
Gold FAQs
Gold has played a key role in human’s history as it has been widely used as a store of value and medium of exchange. Currently, apart from its shine and usage for jewelry, the precious metal is widely seen as a safe-haven asset, meaning that it is considered a good investment during turbulent times. Gold is also widely seen as a hedge against inflation and against depreciating currencies as it doesn’t rely on any specific issuer or government.
Central banks are the biggest Gold holders. In their aim to support their currencies in turbulent times, central banks tend to diversify their reserves and buy Gold to improve the perceived strength of the economy and the currency. High Gold reserves can be a source of trust for a country’s solvency. Central banks added 1,136 tonnes of Gold worth around $70 billion to their reserves in 2022, according to data from the World Gold Council. This is the highest yearly purchase since records began. Central banks from emerging economies such as China, India and Turkey are quickly increasing their Gold reserves.
Gold has an inverse correlation with the US Dollar and US Treasuries, which are both major reserve and safe-haven assets. When the Dollar depreciates, Gold tends to rise, enabling investors and central banks to diversify their assets in turbulent times. Gold is also inversely correlated with risk assets. A rally in the stock market tends to weaken Gold price, while sell-offs in riskier markets tend to favor the precious metal.
The price can move due to a wide range of factors. Geopolitical instability or fears of a deep recession can quickly make Gold price escalate due to its safe-haven status. As a yield-less asset, Gold tends to rise with lower interest rates, while higher cost of money usually weighs down on the yellow metal. Still, most moves depend on how the US Dollar (USD) behaves as the asset is priced in dollars (XAU/USD). A strong Dollar tends to keep the price of Gold controlled, whereas a weaker Dollar is likely to push Gold prices up.
Artigos Recomendados


