Silver Price Forecast: Silver finds temporary support at Fibonacci level, RSI oversold
- Silver is in a short-term downtrend after rolling over at the late-August high.
- The price has found support from a key Fibonacci retracement and is oversold indicating risk of a correction.
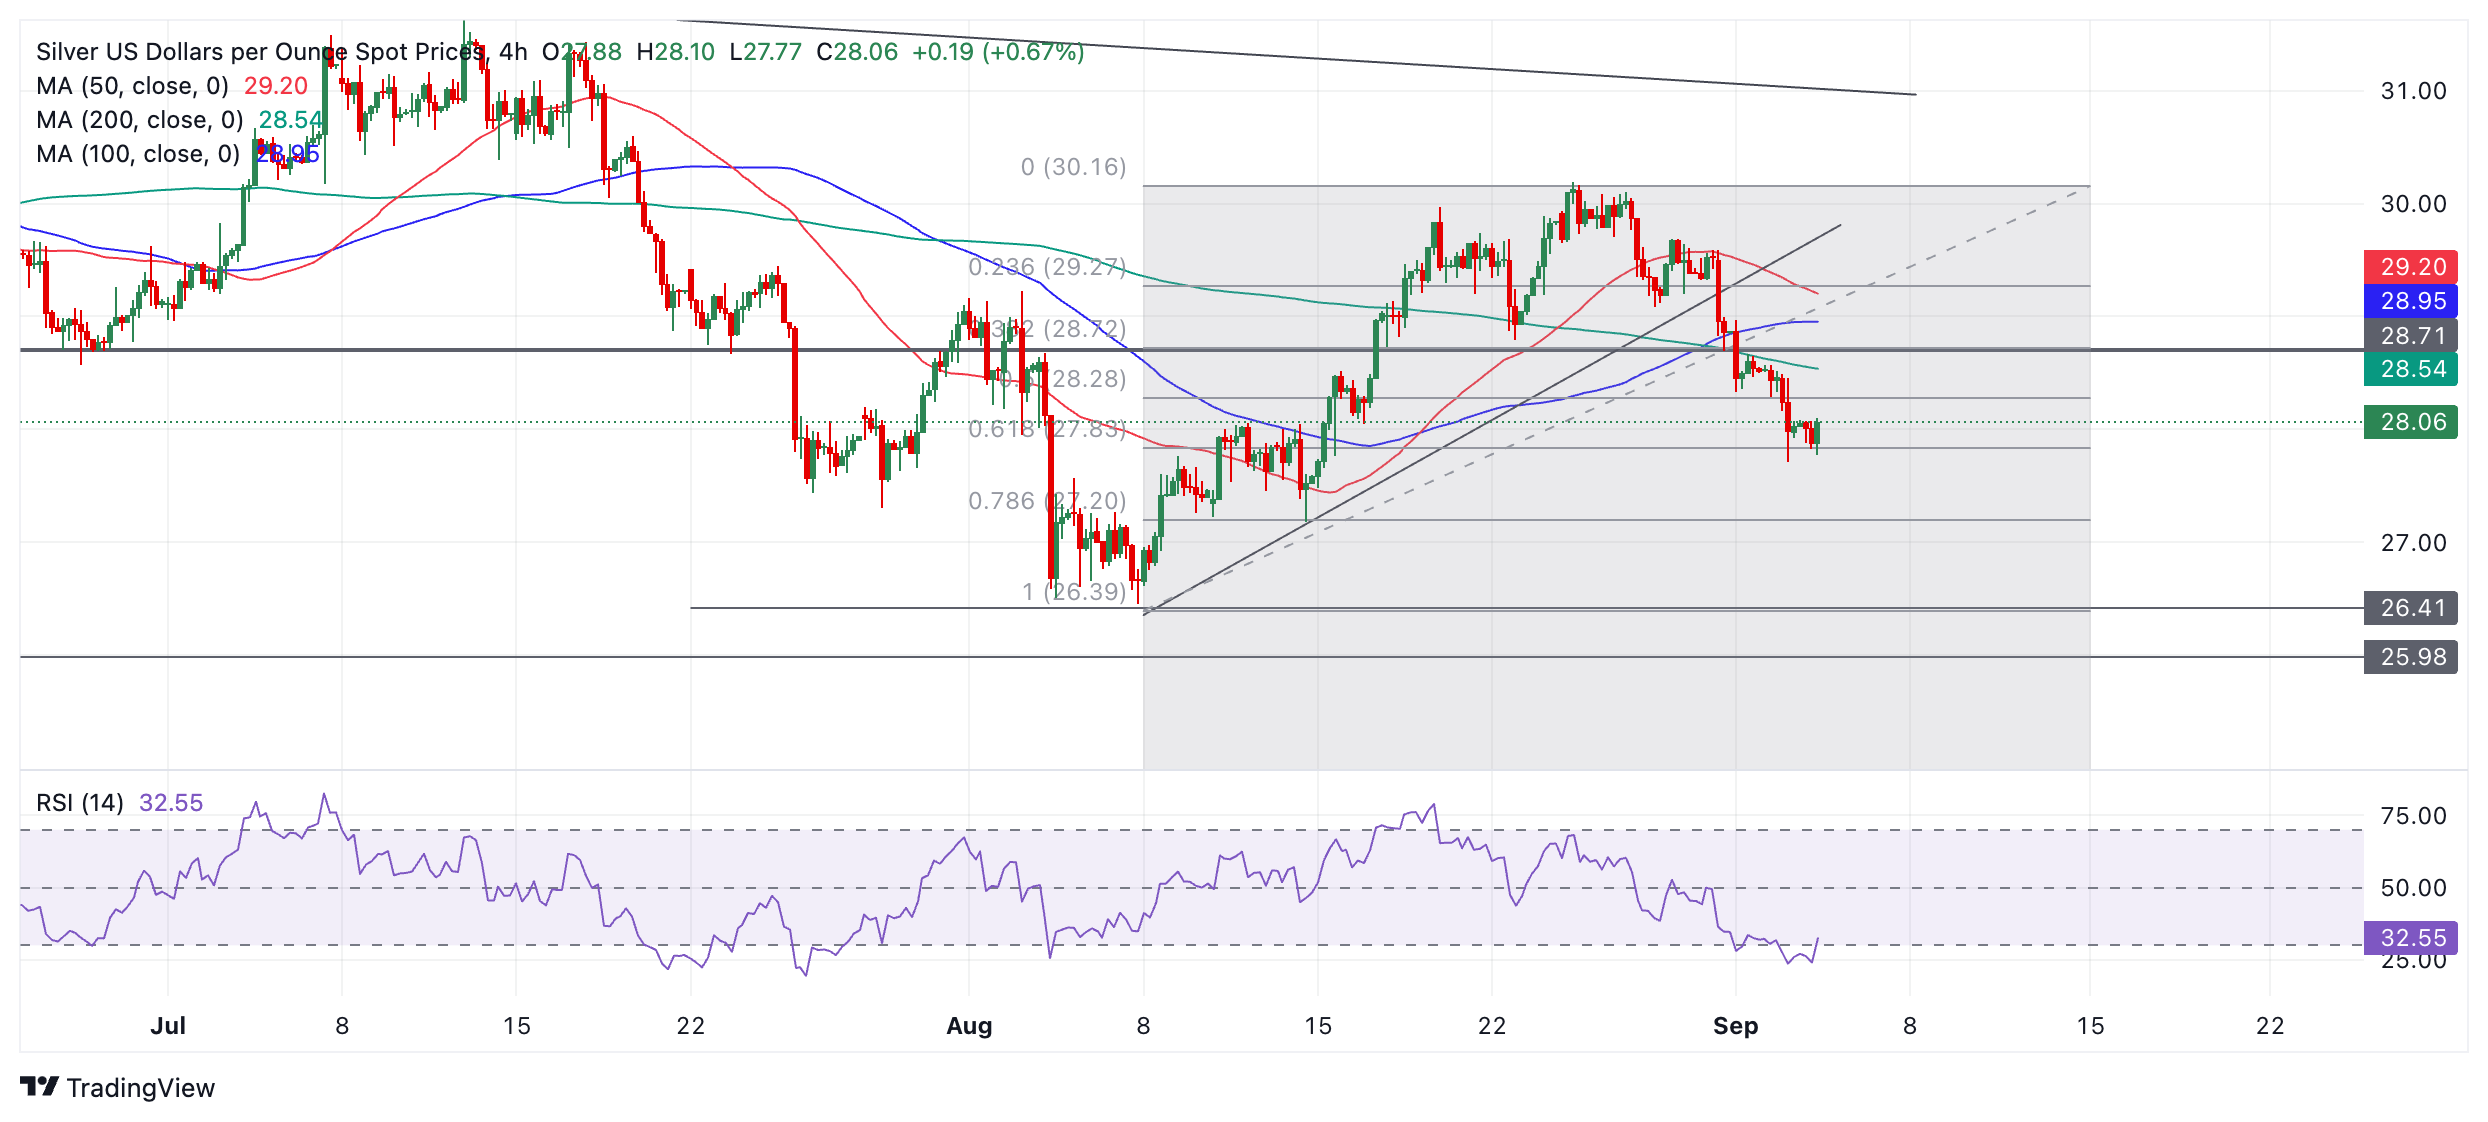
Silver (XAG/USD) has established a sequence of falling peaks and troughs on the 4-hour chart since it rolled over at the August 26 high. This suggests the precious metal is in a new short-term downtrend, and given “the trend is your friend” will continue lower.
Silver 4-hour Chart
Silver is currently finding support at a key level – the 0.618 Fibonacci ratio retracement of the August rally.
The Relative Strength Index (RSI) momentum indicator has fallen into oversold territory and although it is shown exiting oversold on the current bar it is not possible to tell whether it will close that way until the 4-hour period finishes. If it does rise out of oversold it will give a buy signal and, taken together with the support from the Fibonacci retracement, could indicate a temporary bottom in the downtrend.
If a correction higher unfolds it will probably meet resistance between $28.28 (the 0.50 Fib retracement) and $28.33 (September 2 swing low). Given the trend is down it would be expected to resume its decline thereafter.
In any case, a break below $27.71 (September 3 low) would produce a lower low and extend the downtrend. The next target is the August low at $26.41.
The trend on the medium and longer-term charts is unclear – possibly sideways – indicating little directional bias from higher time frames.


