AUD/USD Price Analysis: Corrects from 0.6600 as US Dollar finds temporary support

Fonte Fxstreet
  • AUD/USD falls vertically from 0.6600 as the US Dollar gets a firm footing.
  • Deepening geopolitical tensions have improved safe-haven appeal.
  • Fed policymakers are less likely to cut interest rates soon.

The AUD/USD pair falls sharply after a steep rally to the round-level resistance of 0.6600 in the early New York session on Thursday. The Aussie asset faces a sell-off as the US Dollar has rebounded amid deepening Middle East tensions.

The Israeli army has intensified bombarding on Rafah, the southern region of Gaza in Palestine, as the former hopes that over 1.4 million refugees have been sheltered there. Escalating Middle East tensions have improved the appeal for safe-haven assets.

Meanwhile, the Federal Open Market Committee (FOMC) minutes for January’s policy meeting indicated that policymakers don’t want to cut interest rates early amid lack of conviction on the progress in inflation declining to the 2% target.

The Australian Dollar remains bullish lately as the Reserve Bank of Australia (RBA) minutes for February policy meeting indicated that policymakers were interested in raising the Official Cash Rate (OCR) further. It indicates that the current monetary policy of the RBA is not sufficiently restrictive to tame sticky price pressures.

Going forward, investors will focus on the United States preliminary S&P Global PMI data for February, which will be published at 14:45 GMT.

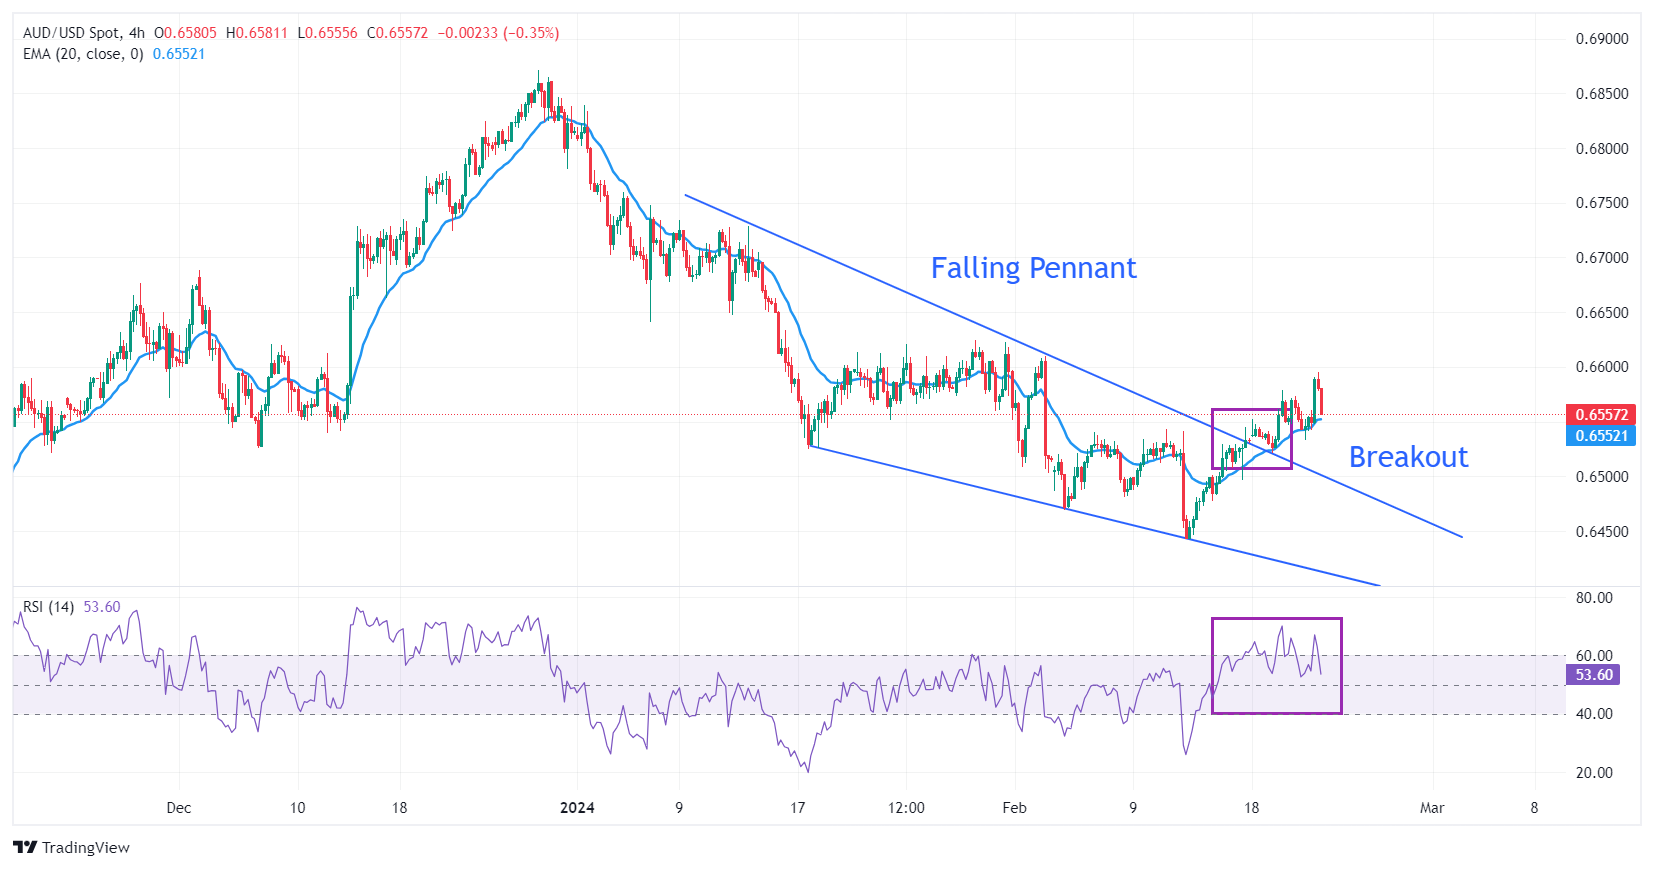
AUD/USD strengthens after a breakout of the Falling Pennant chart pattern formed on a four-hour scale. A breakout of the aforementioned pattern indicates a bullish reversal. The breakout of a Falling Pennant happens when selling pressure dries, and investors consider it a value-buy.

The 20-period Exponential Moving Average (EMA) near 0.6550 continues to provide support to the Australian Dollar bulls.

The 14-period Relative Strength Index (RSI) struggles to sustain in the 60.00-80.00 region. A bullish momentum would trigger if the RSI (14) manages to do so.

Fresh upside would appear if the asset breaks above the round-level resistance of 0.6600, which will drive the asset towards January 30 high at 0.6625, followed by December 4 high at 0.6688.

In an alternate scenario, a downside move below February 15 low at 0.6477 would activate sellers and will expose the asset to February 13 low at 0.6443 and the round-level support of 0.6400.

AUD/USD four-hour chart


Isenção de responsabilidade: Apenas para fins informativos. O desempenho passado não é indicativo de resultados futuros.
placeholder
O preço do ouro atinge um recorde de alta, com o aumento das tensões geopolíticas em focoO preço do ouro (XAU/USD) ganha impulso na segunda-feira. O metal amarelo atingiu um recorde de alta próximo a US$ 2.441 durante a sessão asiática de segunda-feira, em meio a esperanças renovadas de cortes nas taxas de juros do Federal Reserve (Fed) dos EUA e ao aumento das tensões geopolíticas no Oriente Médio.
Autor  FXStreet
5 Mês 20 Dia Seg
O preço do ouro (XAU/USD) ganha impulso na segunda-feira. O metal amarelo atingiu um recorde de alta próximo a US$ 2.441 durante a sessão asiática de segunda-feira, em meio a esperanças renovadas de cortes nas taxas de juros do Federal Reserve (Fed) dos EUA e ao aumento das tensões geopolíticas no Oriente Médio.
placeholder
Até onde o ouro pode subir este ano? Veja o que diz este especialistaInvesting.com – Com a divulgação dos mais recentes índices de inflação, os investidores do ouro permanecem atentos à direção futura dos preços do metal precioso.Embora a expectativa geral seja de que
Autor  Investing.com
6 Mês 14 Dia Sex
Investing.com – Com a divulgação dos mais recentes índices de inflação, os investidores do ouro permanecem atentos à direção futura dos preços do metal precioso.Embora a expectativa geral seja de que
placeholder
VALE3 Vale a Pena Comprar Ações da VALE? Análise Técnica GráficaNo vídeo "VALE3 Vale a Pena Comprar Ações da VALE? Análise Técnica Gráfica" teremos a oportunidade de ver uma análise técnica / análise gráfica das ações VALE3 e também do minério de ferro negociado na bolsa chinesa.
Autor  Roberto Fernandes
6 Mês 17 Dia Seg
No vídeo "VALE3 Vale a Pena Comprar Ações da VALE? Análise Técnica Gráfica" teremos a oportunidade de ver uma análise técnica / análise gráfica das ações VALE3 e também do minério de ferro negociado na bolsa chinesa.
placeholder
UBS enxerga recuperação das commodities mesmo com receios sobre demandaInvesting.com – Mesmo com receios e incertezas a respeito da demanda global, as commodities devem apresentar tendência de recuperação, disseram especialistas do banco UBS em relatório divulgado a clie
Autor  Investing.com
7 Mês 25 Dia Qui
Investing.com – Mesmo com receios e incertezas a respeito da demanda global, as commodities devem apresentar tendência de recuperação, disseram especialistas do banco UBS em relatório divulgado a clie
placeholder
UBS BB inicia cobertura de Banrisul com indicação neutraInvesting.com – Analistas do UBS BB iniciaram a cobertura das ações do Banrisul (BVMF:BRSR6) com recomendação neutra e preço-alvo de R$14. O tradicional banco regional estaria enfrentando novo desafio
Autor  Investing.com
7 Mês 31 Dia Qua
Investing.com – Analistas do UBS BB iniciaram a cobertura das ações do Banrisul (BVMF:BRSR6) com recomendação neutra e preço-alvo de R$14. O tradicional banco regional estaria enfrentando novo desafio
goTop
quote