
GBP/USD holds firm after hitting 9-week high
- GBP/USD touched 1.2690 as UK inflation data boosted rate-cut uncertainty.
- Market wary of potential spending cuts from UK Chancellor Rachel Reeves.
- US data weakens as Dallas Fed Manufacturing Index plunges into contraction.
The Pound Sterling remains firm against the Greenback during the North American session on Monday yet retraced earlier gains after hitting a 9-week high of 1.2690 amid some US dollar weakness. GBP/USD trades at 1.2632 almost flat.
Sterling steadies near 1.2653 as traders eye UK Spring Budget risks
The market mood remains uneasy as traders digest the news that companies are reducing expenses. This is an indication of cautiousness as US President Donald Trump continues to use trade policies to negotiate favorable deals for the US.
Inflation data in the United Kingdom sponsored Cable’s last leg-up. Nevertheless, the release of the Spring budget could weaken the Pound, as Chancellor Rachel Reeves would need to scale back spending if she didn’t want to raise taxes. In that outcome, the Bank of England (BoE) could continue to ease policy as the disinflation process evolves.
Money markets traders expect the BoE will lower rates by 54 basis points in 2025, though they expect gradual adjustments as inflation remains sticky.
In the US, the Dallas Fed Manufacturing Index plunged 22 points to -8.3 in February from a 14.1 three-year high expansion hit a month ago.
On Tuesday, the UK economic docket will feature CBI Distributive Trades and a speech of the BoE Chief Economist Huw Pill. Across the Atlantic, traders are eyeing the Conference Board (CB) Consumer Confidence for February, expected to deteriorate from 104.1 to 103, and speeches from Fed Governor Michael Barr and Richmond Fed Thomas Barkin.
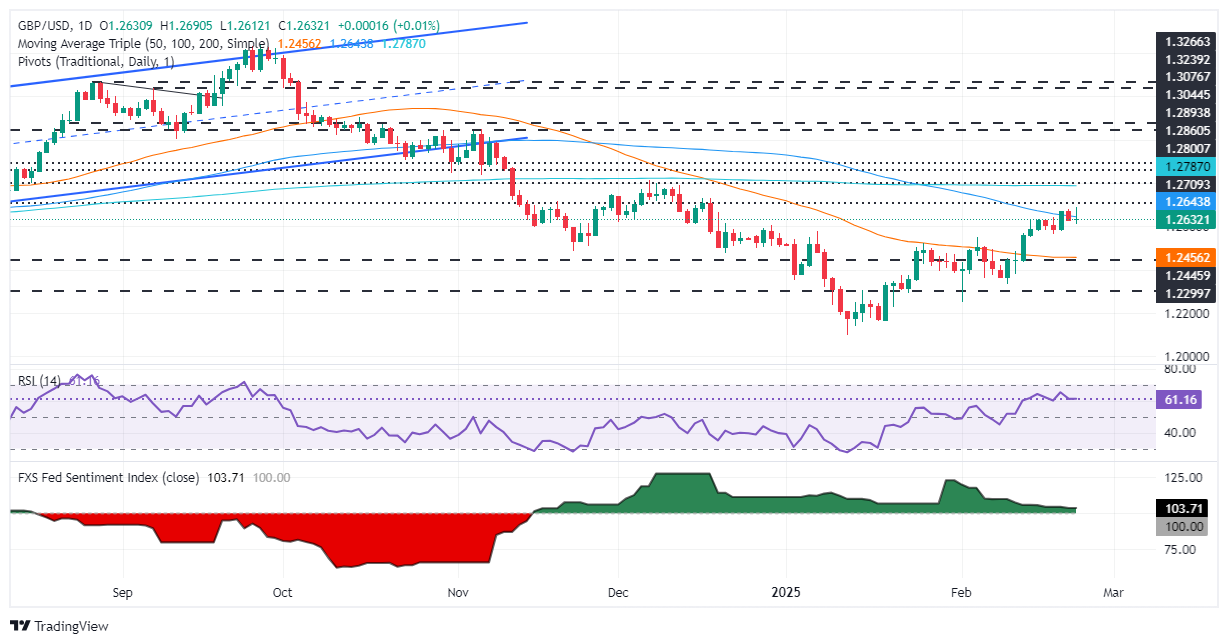
GBP/USD Price Analysis: Technical outlook
The GBP/USD is neutral to upward biased but failed to crack the 100-day Simple Moving Average (SMA) at 1.2653, which opened the door for a pullback. Hence, the GBP/USD key support would be 1.2600, followed by the February 19 swing low of 1.2563. On the other hand, if the pair reclaims the 100-day SMA, buyers could challenge 1.2700 and the 200-day SMA at 1.2787.
British Pound PRICE Today
The table below shows the percentage change of British Pound (GBP) against listed major currencies today. British Pound was the strongest against the Japanese Yen.
| USD | EUR | GBP | JPY | CAD | AUD | NZD | CHF | |
|---|---|---|---|---|---|---|---|---|
| USD | -0.07% | 0.01% | 0.16% | 0.00% | -0.01% | -0.05% | -0.09% | |
| EUR | 0.07% | -0.00% | 0.08% | -0.11% | 0.04% | -0.17% | -0.19% | |
| GBP | -0.01% | 0.00% | 0.13% | -0.11% | 0.05% | -0.16% | -0.19% | |
| JPY | -0.16% | -0.08% | -0.13% | -0.17% | -0.10% | -0.14% | -0.18% | |
| CAD | -0.00% | 0.11% | 0.11% | 0.17% | -0.06% | -0.05% | -0.08% | |
| AUD | 0.00% | -0.04% | -0.05% | 0.10% | 0.06% | -0.21% | -0.24% | |
| NZD | 0.05% | 0.17% | 0.16% | 0.14% | 0.05% | 0.21% | -0.03% | |
| CHF | 0.09% | 0.19% | 0.19% | 0.18% | 0.08% | 0.24% | 0.03% |
The heat map shows percentage changes of major currencies against each other. The base currency is picked from the left column, while the quote currency is picked from the top row. For example, if you pick the British Pound from the left column and move along the horizontal line to the US Dollar, the percentage change displayed in the box will represent GBP (base)/USD (quote).
Artigos Recomendados


