


EUR/AUD Price Forecast: Rallies to two-day high, but not out of the woods
- EUR/AUD sees a notable recovery, advancing 0.74% despite a disappointing IFO business climate from Germany.
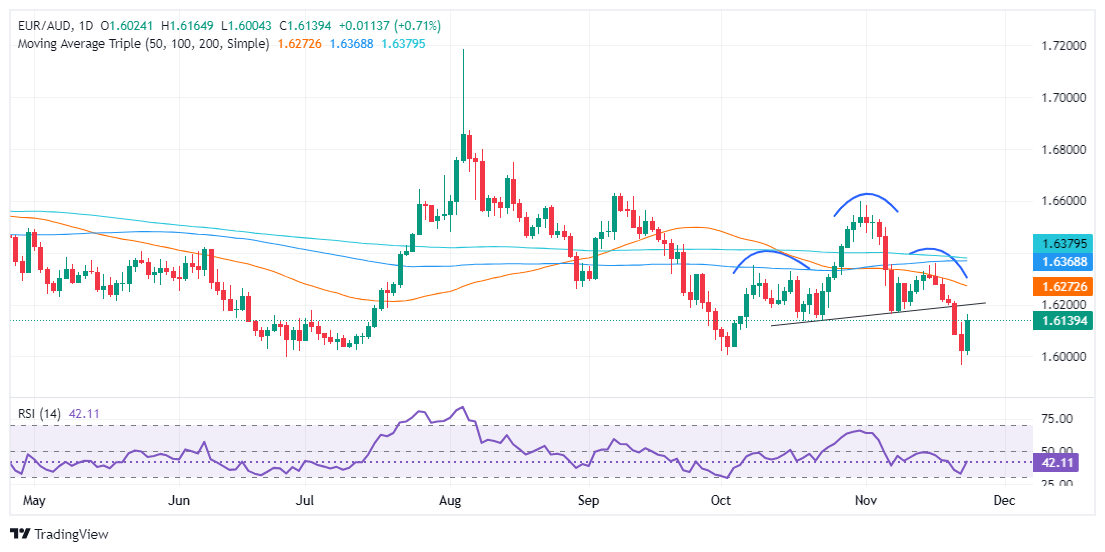
- A potential head-and-shoulder pattern indicates possible continued declines, with key supports at 1.6100, 1.6003, and 1.5963. A further drop could potentially target 1.5900.
- Technical resistances are set at the 50-day SMA of 1.6266 and the psychological mark of 1.6300 if the rally extends.
The EUR/AUD recovered and rallied above the 1.6100 figure, hitting a new two-day high of 1.6163 as risk appetite improved. Softer-than-expected IFO readings in Germany were not an excuse for buyers to buy the shared currency, which the EUR/USD pair have underpinned. At the time of writing, the cross-pair trades at 1.6138, up by 0.74%.
EUR/AUD Price Forecast: Technical outlook
The EUR/AUD is still downward biased despite posting a solid recovery. Yet, the head-and-shoulder chart pattern remains in play, and failure to clear the November 7 low of 1.6161, the latest cycle low, could pave the way for a bearish continuation.
If EUR/AUD drops below 1.6100, the next support would be the November 25 low of 1.6003, followed by the November 22 low of 1.5963. If surpassed, the next support would be 1.5900.
Conversely, if EUR/AUD rallies past 1.6200, immediate resistance emerges at the 50-day Simple Moving Average (SMA) at 1.6266. A breach of the latter will expose 1.6300.
EUR/AUD Price Chart – Daily
Euro FAQs
The Euro is the currency for the 19 European Union countries that belong to the Eurozone. It is the second most heavily traded currency in the world behind the US Dollar. In 2022, it accounted for 31% of all foreign exchange transactions, with an average daily turnover of over $2.2 trillion a day. EUR/USD is the most heavily traded currency pair in the world, accounting for an estimated 30% off all transactions, followed by EUR/JPY (4%), EUR/GBP (3%) and EUR/AUD (2%).
The European Central Bank (ECB) in Frankfurt, Germany, is the reserve bank for the Eurozone. The ECB sets interest rates and manages monetary policy. The ECB’s primary mandate is to maintain price stability, which means either controlling inflation or stimulating growth. Its primary tool is the raising or lowering of interest rates. Relatively high interest rates – or the expectation of higher rates – will usually benefit the Euro and vice versa. The ECB Governing Council makes monetary policy decisions at meetings held eight times a year. Decisions are made by heads of the Eurozone national banks and six permanent members, including the President of the ECB, Christine Lagarde.
Eurozone inflation data, measured by the Harmonized Index of Consumer Prices (HICP), is an important econometric for the Euro. If inflation rises more than expected, especially if above the ECB’s 2% target, it obliges the ECB to raise interest rates to bring it back under control. Relatively high interest rates compared to its counterparts will usually benefit the Euro, as it makes the region more attractive as a place for global investors to park their money.
Data releases gauge the health of the economy and can impact on the Euro. Indicators such as GDP, Manufacturing and Services PMIs, employment, and consumer sentiment surveys can all influence the direction of the single currency. A strong economy is good for the Euro. Not only does it attract more foreign investment but it may encourage the ECB to put up interest rates, which will directly strengthen the Euro. Otherwise, if economic data is weak, the Euro is likely to fall. Economic data for the four largest economies in the euro area (Germany, France, Italy and Spain) are especially significant, as they account for 75% of the Eurozone’s economy.
Another significant data release for the Euro is the Trade Balance. This indicator measures the difference between what a country earns from its exports and what it spends on imports over a given period. If a country produces highly sought after exports then its currency will gain in value purely from the extra demand created from foreign buyers seeking to purchase these goods. Therefore, a positive net Trade Balance strengthens a currency and vice versa for a negative balance.
Artigos Recomendados


