


USD/CAD Price Forecast: Rises above 1.4000 toward ascending channel’s upper boundary
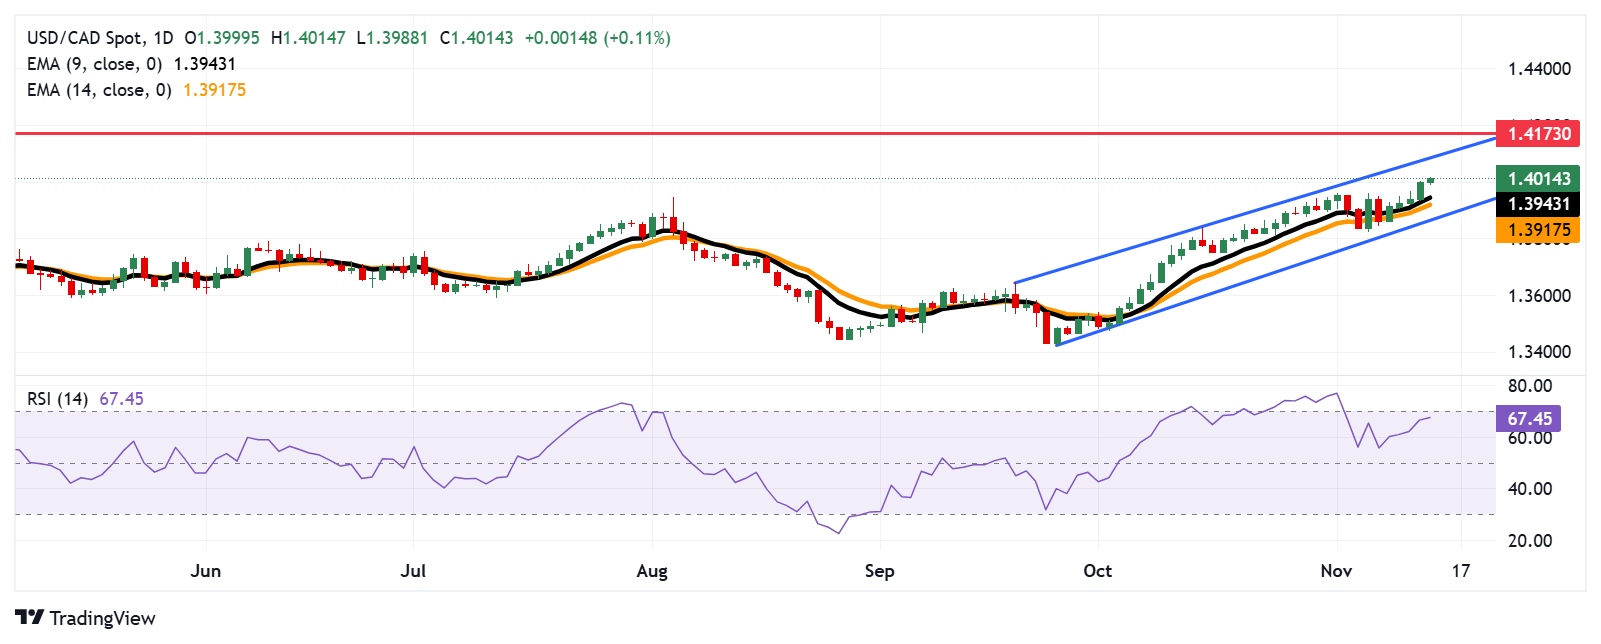
- The USD/CAD pair may approach the upper boundary of the ascending channel at the 1.4080 level.
- Traders may anticipate a potential downward correction if the 14-day RSI surpasses the 70 mark.
- The immediate support appears at the nine-day EMA at 1.3943 level followed by the 14-day EMA at the 1.3917 level.
The USD/CAD pair gains ground for the fifth successive day, trading around 1.4010 during the Asian session on Thursday. On the daily chart, the analysis indicates that the pair moves upwards within an ascending channel pattern, suggesting an ongoing bullish bias.
The 14-day Relative Strength Index (RSI), a widely used indicator for spotting overbought or oversold conditions, is currently just under the 70 level. This suggests ongoing bullish momentum without yet signaling an overbought state. If the 14-day RSI surpasses 70, traders may anticipate a potential downward correction. A pullback from overbought levels could push the pair back toward the 1.4000-1.3950 range.
On the upside, the USD/CAD pair could test the area near the upper boundary of the ascending channel at the 1.4080 level. A breakout above this channel could strengthen the prevailing bullish trend and propel the pair toward 1.4173, the next key resistance level reached in May 2020.
In terms of support, the USD/CAD pair could test immediate support around the nine-day Exponential Moving Average (EMA) at the 1.3943 level, followed by the 14-day EMA at the 1.3917 level. A break below these EMAs could cause the weakening of the bullish bias and put downward pressure on the pair to test the lower boundary of the ascending channel at the 1.3860 level.
USD/CAD: Daily Chart
Canadian Dollar FAQs
The key factors driving the Canadian Dollar (CAD) are the level of interest rates set by the Bank of Canada (BoC), the price of Oil, Canada’s largest export, the health of its economy, inflation and the Trade Balance, which is the difference between the value of Canada’s exports versus its imports. Other factors include market sentiment – whether investors are taking on more risky assets (risk-on) or seeking safe-havens (risk-off) – with risk-on being CAD-positive. As its largest trading partner, the health of the US economy is also a key factor influencing the Canadian Dollar.
The Bank of Canada (BoC) has a significant influence on the Canadian Dollar by setting the level of interest rates that banks can lend to one another. This influences the level of interest rates for everyone. The main goal of the BoC is to maintain inflation at 1-3% by adjusting interest rates up or down. Relatively higher interest rates tend to be positive for the CAD. The Bank of Canada can also use quantitative easing and tightening to influence credit conditions, with the former CAD-negative and the latter CAD-positive.
The price of Oil is a key factor impacting the value of the Canadian Dollar. Petroleum is Canada’s biggest export, so Oil price tends to have an immediate impact on the CAD value. Generally, if Oil price rises CAD also goes up, as aggregate demand for the currency increases. The opposite is the case if the price of Oil falls. Higher Oil prices also tend to result in a greater likelihood of a positive Trade Balance, which is also supportive of the CAD.
While inflation had always traditionally been thought of as a negative factor for a currency since it lowers the value of money, the opposite has actually been the case in modern times with the relaxation of cross-border capital controls. Higher inflation tends to lead central banks to put up interest rates which attracts more capital inflows from global investors seeking a lucrative place to keep their money. This increases demand for the local currency, which in Canada’s case is the Canadian Dollar.
Macroeconomic data releases gauge the health of the economy and can have an impact on the Canadian Dollar. Indicators such as GDP, Manufacturing and Services PMIs, employment, and consumer sentiment surveys can all influence the direction of the CAD. A strong economy is good for the Canadian Dollar. Not only does it attract more foreign investment but it may encourage the Bank of Canada to put up interest rates, leading to a stronger currency. If economic data is weak, however, the CAD is likely to fall.
Artigos Recomendados


