EUR/CAD Price Forecast: Remains below 1.4850, next barrier at a pullback resistance

Fonte Fxstreet
  • EUR/CAD may find an immediate barrier around a “pullback resistance” at the 1.4870 level.
  • The 14-day RSI remains below the 50 level; a further decline toward the 30 mark would strengthen bearish bias.
  • The psychological level of 1.4800 appears as the immediate support for the pair.

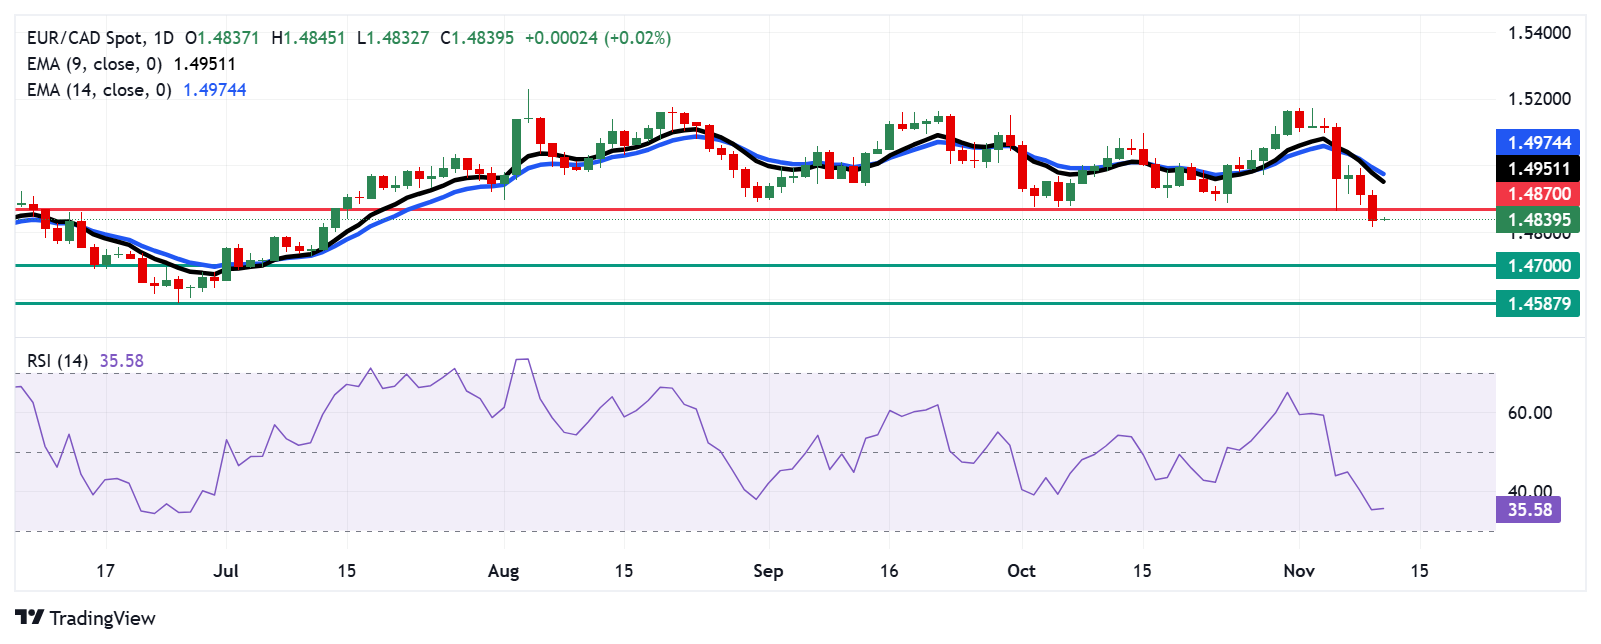
The EUR/CAD cross attempts to halt its two days of losses, trading around 1.4840 during the Asian session on Tuesday. An analysis of the daily chart highlights a strong bearish bias, as the pair remains below the nine-day Exponential Moving Average (EMA).

The 14-day Relative Strength Index (RSI), a key momentum indicator, stays below the 50 level, indicating sustained bearish momentum. A further dip toward the 30 level would intensify this downward trend for the EUR/CAD cross.

Additionally, the nine-day Exponential Moving Average (EMA) remains below the 14-day EMA, signaling continued weakness in short-term price momentum for the EUR/CAD cross.

On the downside, the EUR/CAD cross may test the psychological level of 1.4800, followed by the key level of 1.4700. A break below the latter could put downward pressure on the pair to navigate the region around its seven-month low of 1.4587 level.

Regarding the resistance, the EUR/CAD cross finds an immediate barrier around “throwback support” turned “pullback resistance” at the 1.4870 level. A break above the level could lead the pair to test the nine-day EMA at 1.4951 level, followed by the 14-day EMA at 1.4974 level.

EUR/CAD: Daily Chart
Euro PRICE Today

The table below shows the percentage change of Euro (EUR) against listed major currencies today. Euro was the strongest against the Australian Dollar.

  USD EUR GBP JPY CAD AUD NZD CHF
USD   0.14% 0.23% -0.02% 0.16% 0.33% 0.09% 0.07%
EUR -0.14%   0.09% -0.16% 0.02% 0.19% -0.05% -0.07%
GBP -0.23% -0.09%   -0.26% -0.06% 0.10% -0.15% -0.15%
JPY 0.02% 0.16% 0.26%   0.19% 0.36% 0.12% 0.11%
CAD -0.16% -0.02% 0.06% -0.19%   0.17% -0.06% -0.09%
AUD -0.33% -0.19% -0.10% -0.36% -0.17%   -0.22% -0.25%
NZD -0.09% 0.05% 0.15% -0.12% 0.06% 0.22%   -0.03%
CHF -0.07% 0.07% 0.15% -0.11% 0.09% 0.25% 0.03%  

The heat map shows percentage changes of major currencies against each other. The base currency is picked from the left column, while the quote currency is picked from the top row. For example, if you pick the Euro from the left column and move along the horizontal line to the US Dollar, the percentage change displayed in the box will represent EUR (base)/USD (quote).

Isenção de responsabilidade: Apenas para fins informativos. O desempenho passado não é indicativo de resultados futuros.
placeholder
Previsão do preço do ouro: XAU/USD sobe para quase um recorde de alta abaixo de US$ 3.100 em meio à incerteza globalO preço do ouro (XAU/USD) ganha impulso para cerca de US$ 3.090 durante o início da sessão asiática de segunda-feira.
Autor  FXStreet
3 Mês 31 Dia Seg
O preço do ouro (XAU/USD) ganha impulso para cerca de US$ 3.090 durante o início da sessão asiática de segunda-feira.
placeholder
Wall Street diz aos investidores que 'vendam qualquer salto' enquanto o Dow Jones mergulha no primeiro mercado aberto do segundo trimestreWall Street abriu o segundo trimestre de 2025, com uma queda em geral quando as ações da tecnologia foram marteladas e a média industrial da Dow Jones caiu 114 pontos na terça -feira de manhã. Isso ocorreu quando o mercadodent o próximo anúncio tarifário de Donald Trump, programado para quarta -feira, 2 de abril. O S&P 500 fechou o dia […]
Autor  Cryptopolitan
Ontem 01: 21
Wall Street abriu o segundo trimestre de 2025, com uma queda em geral quando as ações da tecnologia foram marteladas e a média industrial da Dow Jones caiu 114 pontos na terça -feira de manhã. Isso ocorreu quando o mercadodent o próximo anúncio tarifário de Donald Trump, programado para quarta -feira, 2 de abril. O S&P 500 fechou o dia […]
placeholder
Ouro cai das máximas antes do Dia da Liberação de TrumpOs preços do ouro recuaram na terça-feira, com os investidores realizando lucros, aguardando o Dia da Liberação, em 2 de abril, nos EUA, um evento em que o presidente Donald Trump deverá anunciar tarifas adicionais com o objetivo de melhorar o desequilíbrio do déficit comercial.
Autor  FXStreet
Ontem 02: 20
Os preços do ouro recuaram na terça-feira, com os investidores realizando lucros, aguardando o Dia da Liberação, em 2 de abril, nos EUA, um evento em que o presidente Donald Trump deverá anunciar tarifas adicionais com o objetivo de melhorar o desequilíbrio do déficit comercial.
placeholder
Previsão de preço do Solana para abril de 2025: traders de SOL correm risco de reversão para $120 à medida que a FTX inicia reembolsos de $800 milhões em 30 de maio.O preço da Solana se consolidou abaixo de $130 na terça-feira, enfrentando ventos contrários crescentes em abril, à medida que os investidores ficam cautelosos com as iminentes vendas pela FTX.
Autor  FXStreet
Ontem 02: 35
O preço da Solana se consolidou abaixo de $130 na terça-feira, enfrentando ventos contrários crescentes em abril, à medida que os investidores ficam cautelosos com as iminentes vendas pela FTX.
placeholder
A Grayscale apresentou o formulário S-3 para o ETF Digital Large Cap, que inclui Bitcoin, Ethereum, XRP, Solana e CardanoA NYSE Arca apresentou o formulário 19b-4 para listar e negociar o GDLC em outubro de 2024.
Autor  FXStreet
20 horas atrás
A NYSE Arca apresentou o formulário 19b-4 para listar e negociar o GDLC em outubro de 2024.
Produtos relacionados
goTop
quote