

AUD/USD Price Forecast: Falls back inside range signaling possible bearish reversal

Fonte Fxstreet
  • AUD/USD stalls at upside resistance and reverses lower, falling back inside its range. 
  • It is threatening a short-term trend reversal and MACD is about to cross below its signal line. 

AUD/USD reverses and starts falling after what appears to be a false breakout above the top of the range. 

AUD/USD Daily Chart 
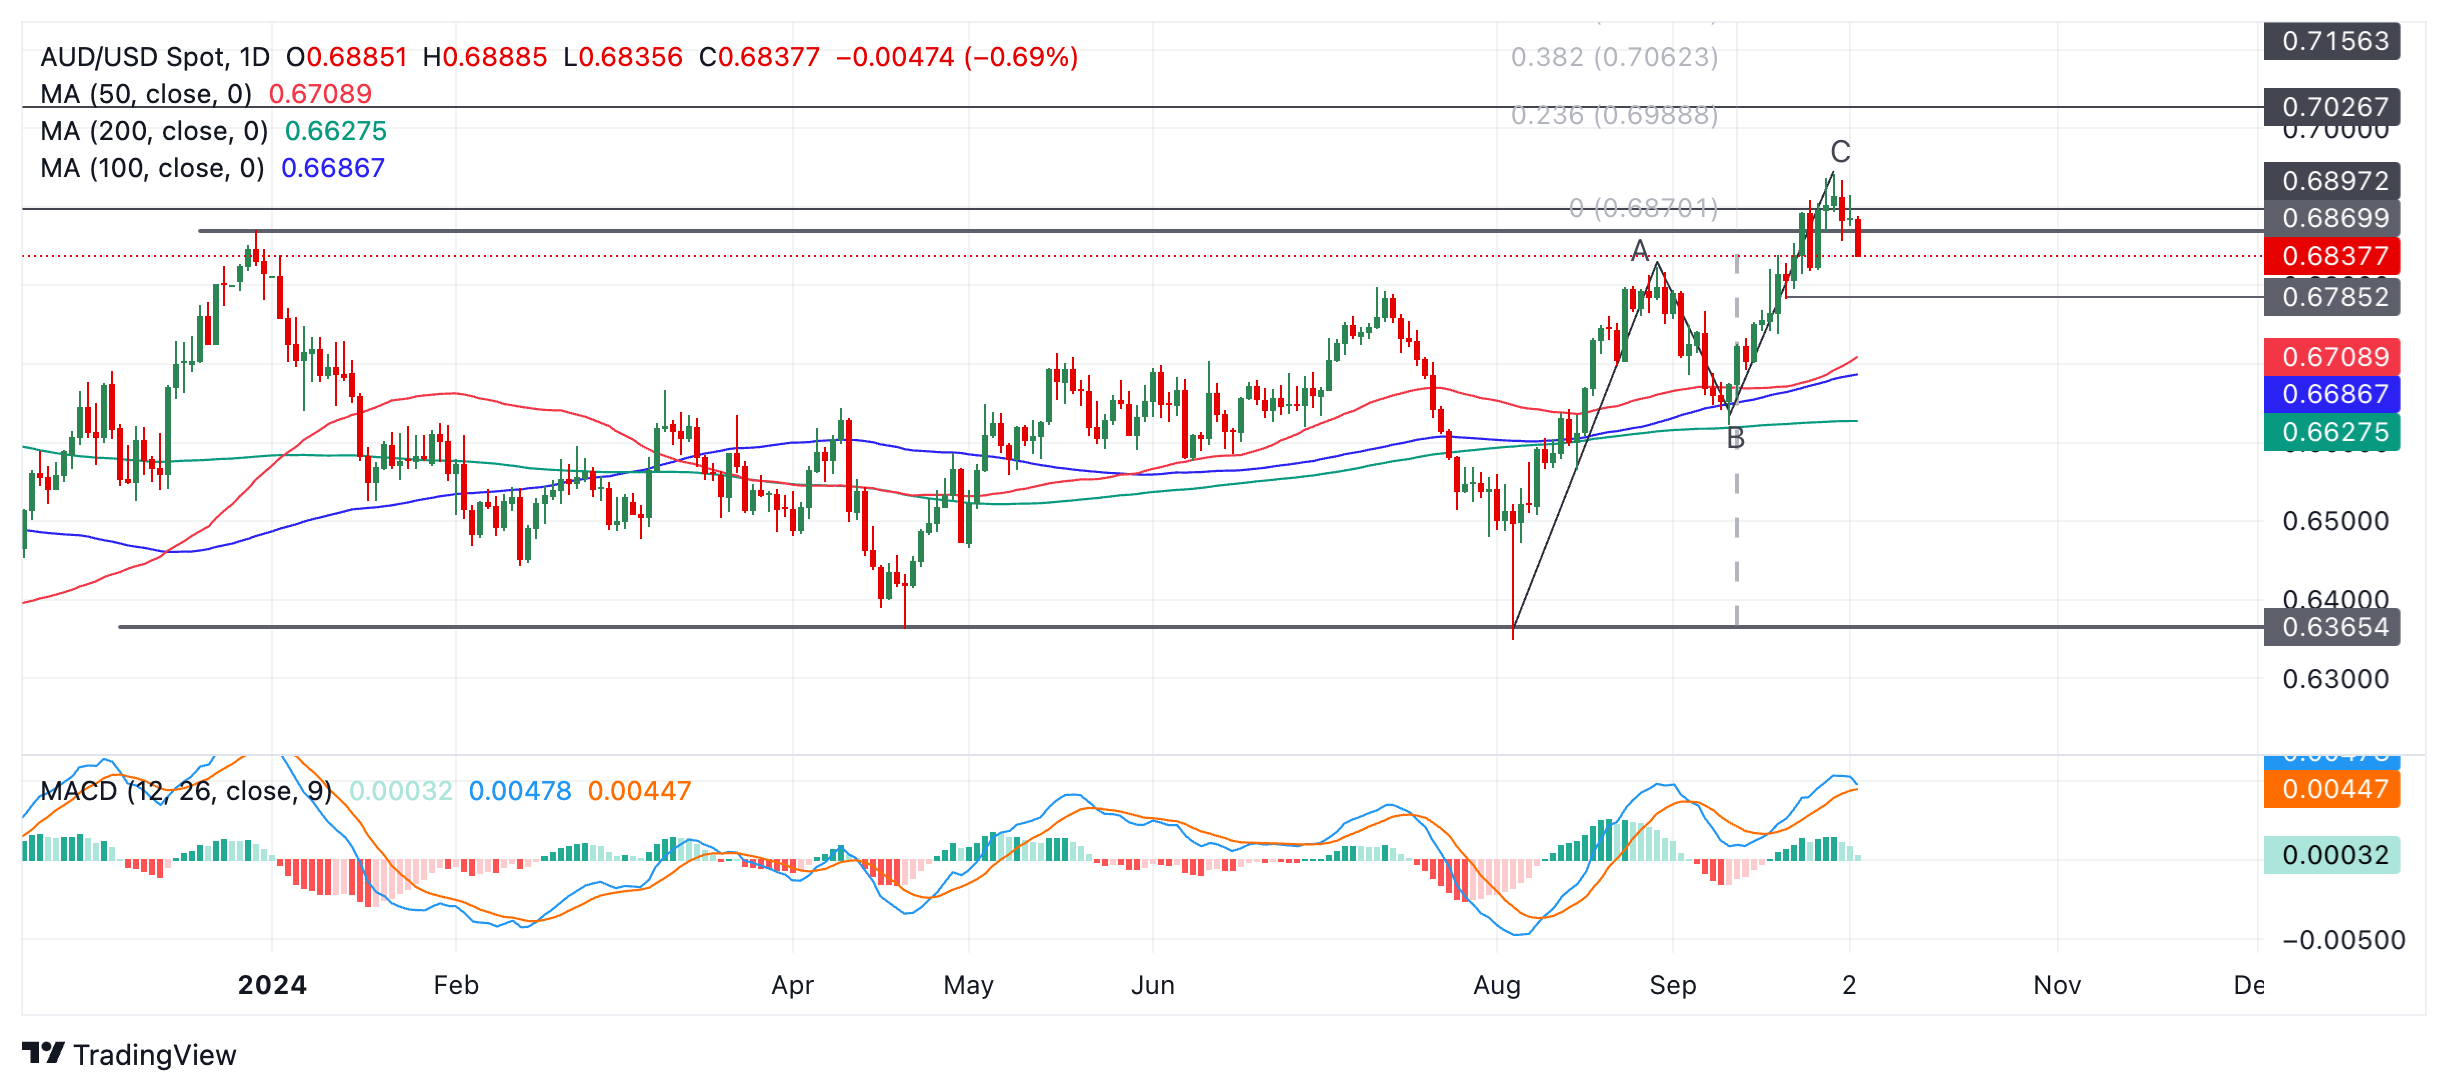
The Aussie pair has now started falling back inside the range. It is possible this could be the start of a new short-term downtrend that might take AUD/USD back down towards the range lows in the 0.63s, however, it is still too early to say with any confidence.  

The blue Moving Average Convergence Divergence (MACD) line is threatening to cross below the red signal line and if it does that would add further evidence to the argument that AUD/USD is reversing trend. 

AUD/USD may have formed a Measured Move pattern during August and September as it rose from the bottom to the top of the range. Such patterns resemble zig-zags and lengths of waves A and C are similar or related by Fibonacci.  

The Aussie pair reached an initial upside target based on extrapolating wave A of the Measured Move higher by a 61.8% Fibonacci. This target lies at around 0.6115. This is further evidence the uptrend may have reached its zenith and a new downtrend is currently forming. For more confirmation price would have to break below the 0.6785 level (September 20 swing low). Such a move would be expected to reach an initial downside target of 0.6709, the level of the 50-day Simple Moving Average (SMA). 

Until then, there is still a risk the move down could stall and the uptrend resume, taking AUD/USD higher again. A break above the 0.6942 September 30 peak would confirm a resumption of the uptrend and target 0.6988 (14 February ‘23 swing high), followed by 0.7156 in a bullish case (2 February ‘23 high).


Isenção de responsabilidade: Apenas para fins informativos. O desempenho passado não é indicativo de resultados futuros.
placeholder
Quais BDRs pagam mais dividendos? E quais têm maior valorização? Veja rankingInvesting.com – O setor financeiro é o que mais paga dividendos entre companhias estrangeiras, de acordo com ranking de Brazilian Depositary Receipts (BDRs) da Grana Capital com dados da B3 (BVMF:B3SA
Autor  Investing.com
23 out. 2024
Investing.com – O setor financeiro é o que mais paga dividendos entre companhias estrangeiras, de acordo com ranking de Brazilian Depositary Receipts (BDRs) da Grana Capital com dados da B3 (BVMF:B3SA
placeholder
RBRX11 conclui incorporação e mantém dividendo; HGLG11 propõe fusão com LVBI11 e PATL11O fundo imobiliário RBR Plus Multiestratégia Real Estate (RBRX11), classificado como o "hedge fund" da gestora RBR Asset, divulgou seus resultados referentes ao mês de outubro. O período foi marcado pela distribuição de R$ 0,09 por cota aos seus investidores.
Autor  Pedro Augusto Prazeres
05 dez. 2025
O fundo imobiliário RBR Plus Multiestratégia Real Estate (RBRX11), classificado como o "hedge fund" da gestora RBR Asset, divulgou seus resultados referentes ao mês de outubro. O período foi marcado pela distribuição de R$ 0,09 por cota aos seus investidores.
placeholder
Ouro segue perto da máxima de 5 de junho enquanto recuo nas apostas de alta de juros pelo Fed enfraquece o dólarO ouro (XAU/USD) dá continuidade à recuperação de sexta-feira a partir da região de US$ 4.300, sua mínima em uma semana, e ganha tração positiva adicional no início de uma nova semana.
Autor  FXStreet
8 Mês 17 Dia Seg
O ouro (XAU/USD) dá continuidade à recuperação de sexta-feira a partir da região de US$ 4.300, sua mínima em uma semana, e ganha tração positiva adicional no início de uma nova semana.
placeholder
Ouro avança para nova máxima desde junho com renovada venda de dólares e perda de força nas apostas de alta de juros do FedO ouro (XAU/USD) atinge uma nova máxima desde o início de junho, ao redor da região de US$ 4.544, durante a sessão asiática desta sexta-feira e busca dar continuidade ao ímpeto acima da Média Móvel Simples (MMS) de 200 dias, de grande relevância técnica.
Autor  FXStreet
8 Mês 21 Dia Sex
O ouro (XAU/USD) atinge uma nova máxima desde o início de junho, ao redor da região de US$ 4.544, durante a sessão asiática desta sexta-feira e busca dar continuidade ao ímpeto acima da Média Móvel Simples (MMS) de 200 dias, de grande relevância técnica.
placeholder
Bitcoin disparou 10% em um dia e ultrapassa US$ 77.000, atingindo máxima de três mesesTradingKey - O Bitcoin disparou 10% e ultrapassou a marca de US$ 77.000, atingindo a máxima em três meses, com potencial para ampliar seus ganhos.Em 21 de agosto, o Bitcoin (BTC) iniciou uma nova onda
Autor  TradingKey
8 Mês 21 Dia Sex
TradingKey - O Bitcoin disparou 10% e ultrapassou a marca de US$ 77.000, atingindo a máxima em três meses, com potencial para ampliar seus ganhos.Em 21 de agosto, o Bitcoin (BTC) iniciou uma nova onda
Produtos relacionados
goTop
quote