

Mexican Peso edges lower ahead of central bank decision time
- The Mexican Peso tardes slightly lower, extending the mild weakening from Monday.
- US Retail Sales data, the Fed policy meeting and BoE meeting are key events this week.
- USD/MXN forms a bearish “Three Black Crows” Japanese candlestick pattern.
The Mexican Peso (MXN) edges lower on Tuesday morning after mildly retreating the prior day. This may be as a result of profit-taking after MXN’s average 3.9% rally last week against its most heavily-traded counterparts (the US Dollar (USD), the Euro (EUR), and the Pound Sterling (GBP)), or possibly trader caution ahead of the much-anticipated Federal Reserve (Fed) policy meeting announcement on Wednesday.
Mexican Peso trades tight ahead of Fed meeting
The Mexican Peso trades flat as the market debates the possibility that the Fed will cut interest rates by a double-dose 0.50% at their meeting on Wednesday, with the CME FedWatch tool now referencing a 67% probability of such a “jumbo” cut. This is more than double the probability of a 0.25% cut alone (33%). The chances of 0.50% have risen eight percentage points higher than yesterday’s 59%.
A cut to base interest rates in the US would widen the already substantial gap between the two countries and weaken the USD/MXN. In Mexico, the Bank of Mexico (Banxico) has set a base rate of 10.75% versus the Fed’s 5.25%-5.50% band. If the Fed cuts by 0.50%, as now seems likely, the Fed’s rate will fall to 4.75%-5.25%. This, in turn, will favor capital flowing to Mexico, where it can earn substantially more interest, resulting in increased demand for the Mexican Peso and its appreciation.
US Retail Sales data for August out at 12:30 GMT on Tuesday is the last major economic data release for the US prior to the conclusion of the Fed meeting on Wednesday. Economists expect a 0.2% rise month-over-month after a 1.0% rise in July. If the data undershoots, it will ratchet up the chances of a 0.50% cut even higher, and the opposite if it beats them.
Against the GBP, the Mexican Peso has weakened a little more over recent sessions as the Bank of England (BoE), scheduled to meet on Thursday, is seen as much less likely to cut interest rates. Yet the outlook for the Pound is far from positive as the latest Gross Domestic Product (GDP) data came out flat for July, undershooting economists’ expectations of 0.2% growth, so cuts are probably coming in the future, but with delays due to stickier inflation.
It is a similar story for the Euro, with Germany suffering slower growth but wage inflation remaining too high for the European Central Bank (ECB) to aggressively cut interest rates. Plus, the ECB has already begun cutting interest rates, so unlike the Fed, it is not playing “catch-up”. The just-released German and Eurozone ZEW sentiment survey showed a sharp fall in September suggesting more bad news on the economic front, and EUR/MXN pair is losing ground as a result.
Domestic politics has been another factor influencing the Mexican Peso ever since the June election. Initially, markets discounted the Peso due to fears about a fall in foreign investment due to proposed constitutional reforms by the Morena-led coalition government. These concerns have subsided recently, and one of the most controversial of them – the election rather than appointment of judges – passed into law on Sunday when outgoing president Andres Manuel Lopez Obrador signed an official decree, according to El Financiero.
At the time of writing, one US Dollar (USD) buys 19.25 Mexican Pesos, EUR/MXN trades at 21.44, and GBP/MXN at 25.44.
Technical Analysis: USD/MXN forms bearish “Three Black Crows” pattern
USD/MXN has broken out of a rising mini-channel within a wider rising channel and fallen for three days in a row. This has now formed a bearish Three Black Crows Japanese candlestick pattern on the daily chart (shaded rectangle), which indicates the probability that prices will fall even lower in the short term.
USD/MXN Daily Chart
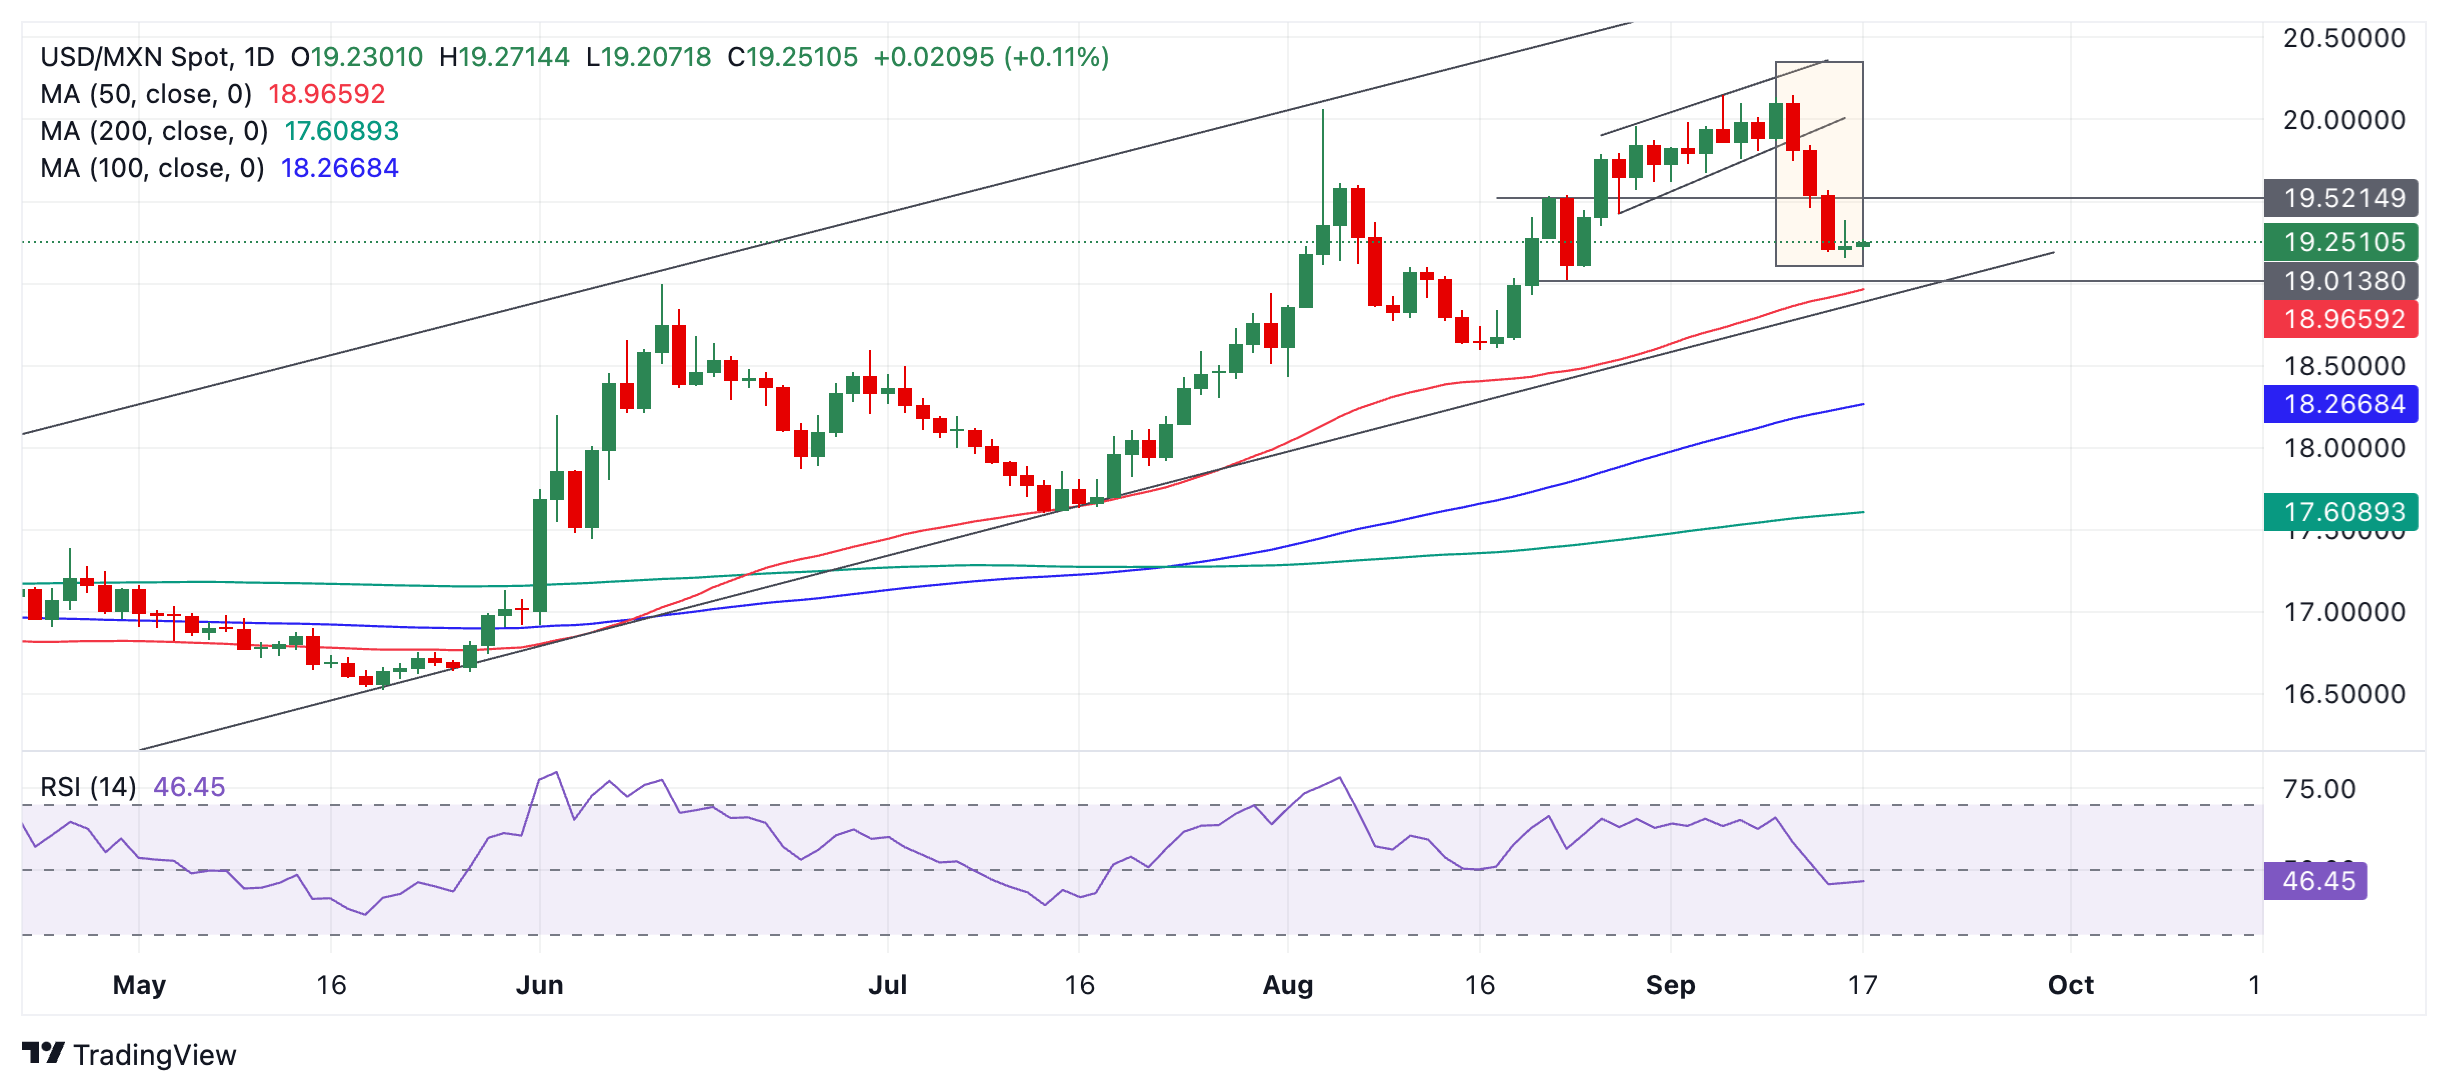
The odds now favor the pair falling to the next downside support level at 19.01 (August 23 low), followed perhaps by further weakness to the 50-day Simple Moving Average (SMA) at 18.94 and the lower trendline of the larger channel a few pips below. At that level, the price will probably find firm support to stabilize and perhaps recover.
Even though the short-term trend is bearish, the medium and long-term trends are still bullish, suggesting the possibility that the pair could recover eventually and continue to trade higher.
Economic Indicator
Retail Sales (MoM)
The Retail Sales data, released by the US Census Bureau on a monthly basis, measures the value in total receipts of retail and food stores in the United States. Monthly percent changes reflect the rate of changes in such sales. A stratified random sampling method is used to select approximately 4,800 retail and food services firms whose sales are then weighted and benchmarked to represent the complete universe of over three million retail and food services firms across the country. The data is adjusted for seasonal variations as well as holiday and trading-day differences, but not for price changes. Retail Sales data is widely followed as an indicator of consumer spending, which is a major driver of the US economy. Generally, a high reading is seen as bullish for the US Dollar (USD), while a low reading is seen as bearish.
Read more.Next release: Tue Sep 17, 2024 12:30
Frequency: Monthly
Consensus: 0.2%
Previous: 1%
Source: US Census Bureau
Retail Sales data published by the US Census Bureau is a leading indicator that gives important information about consumer spending, which has a significant impact on the GDP. Although strong sales figures are likely to boost the USD, external factors, such as weather conditions, could distort the data and paint a misleading picture. In addition to the headline data, changes in the Retail Sales Control Group could trigger a market reaction as it is used to prepare the estimates of Personal Consumption Expenditures for most goods.
Artigos Recomendados


