

GBP/USD Price Forecast: Hits five-day peak above 1.3200

Fonte Fxstreet
  • GBP/USD nears 1.3239, with potential to test the YTD high at 1.3266 and March 2022 peaks.
  • Bulls bought the dip at 1.3001, fueling the rally to current levels.
  • Failure at 1.3200 could see a pullback towards 1.3150, with further downside risks at 1.3100 and 1.3044.

The Pound Sterling rallied in early trading during the North American session against the Greenback, registering gains of over 0.60% and hitting a five-day peak of 1.3214. At the time of writing, the GBP/USD trades at 1.3199.

GBP/USD Price Forecast: Technical outlook

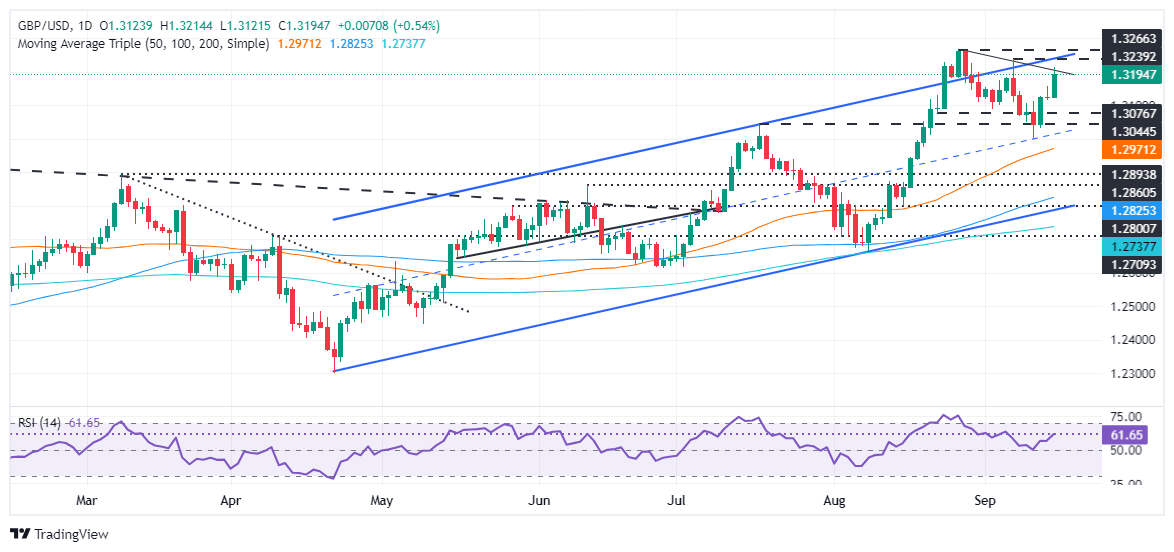
The GBP/USD has risen sharply, as bullish momentum picked up, as portrayed by the Relative Strength Index (RSI). In addition, bulls buying the dip at 1.3001 lifted spot prices to the current exchange rate.

Still, GBP/USD remains shy of testing the September 6 high of 1.3239. In that outcome, the next resistance level would be the year-to-date (YTD) high at 1.3266. Once surpassed, the daily high on March 23, 2022, would be up for grabs at 1.3298 before the pair hits the March 1, 2022, high at 1.3437.

Conversely, if GBP/USD stands below 1.3200, this could exacerbate a re-test of the 1.3100 figure. But firstly, sellers need to challenge 1.3150. Further losses lie at 1.3044, and the July 17 high turned support.

GBP/USD Price Action – Daily Chart
British Pound PRICE Today

The table below shows the percentage change of British Pound (GBP) against listed major currencies today. British Pound was the strongest against the US Dollar.

  USD EUR GBP JPY CAD AUD NZD CHF
USD   -0.42% -0.54% -0.21% -0.02% -0.48% -0.41% -0.31%
EUR 0.42%   -0.18% 0.17% 0.37% -0.12% -0.04% 0.07%
GBP 0.54% 0.18%   0.28% 0.54% 0.06% 0.15% 0.26%
JPY 0.21% -0.17% -0.28%   0.20% -0.21% -0.17% -0.15%
CAD 0.02% -0.37% -0.54% -0.20%   -0.54% -0.40% -0.40%
AUD 0.48% 0.12% -0.06% 0.21% 0.54%   0.08% 0.17%
NZD 0.41% 0.04% -0.15% 0.17% 0.40% -0.08%   0.11%
CHF 0.31% -0.07% -0.26% 0.15% 0.40% -0.17% -0.11%  

The heat map shows percentage changes of major currencies against each other. The base currency is picked from the left column, while the quote currency is picked from the top row. For example, if you pick the British Pound from the left column and move along the horizontal line to the US Dollar, the percentage change displayed in the box will represent GBP (base)/USD (quote).


Isenção de responsabilidade: Apenas para fins informativos. O desempenho passado não é indicativo de resultados futuros.
placeholder
Ações do Japão e da Coreia do Sul divergem: Nikkei 225 sobe quase 2%, Kospi cai 0,48% após queda de 18,8% no terceiro trimestreTradingKey - Em 30 de setembro, os mercados de ações do Japão e da Coreia do Sul divergiram, com as ações japonesas se fortalecendo significativamente, enquanto os papéis sul-coreanos registraram leve
Autor  TradingKey
7 horas atrás
TradingKey - Em 30 de setembro, os mercados de ações do Japão e da Coreia do Sul divergiram, com as ações japonesas se fortalecendo significativamente, enquanto os papéis sul-coreanos registraram leve
placeholder
Previsão do Preço do Ouro: PCE de Agosto dos EUA Iminente, o Preço do Ouro Vai Subir ou Cair no Curto Prazo?TradingKey - Na sessão europeia de 30 de setembro, os preços do ouro (XAUUSD) continuaram a se recuperar após uma forte queda no início desta semana, retomando o patamar de US$ 4.200 no intradiário, c
Autor  TradingKey
7 horas atrás
TradingKey - Na sessão europeia de 30 de setembro, os preços do ouro (XAUUSD) continuaram a se recuperar após uma forte queda no início desta semana, retomando o patamar de US$ 4.200 no intradiário, c
placeholder
Previsão do Preço do Ouro: Ouro despenca para a mínima de sete semanas, o suporte de US$ 4.100 vai resistir?TradingKey - O ouro à vista (XAUUSD) despencou 4% na segunda-feira, fechando a US$ 4.114,93 por onça-troy, após atingir a mínima intradia de US$ 4.110,80, seu menor nível desde 5 de agosto. No início
Autor  TradingKey
Ontem 09: 21
TradingKey - O ouro à vista (XAUUSD) despencou 4% na segunda-feira, fechando a US$ 4.114,93 por onça-troy, após atingir a mínima intradia de US$ 4.110,80, seu menor nível desde 5 de agosto. No início
placeholder
Ações japonesas e sul-coreanas fecham em queda; Nikkei 225 cai 0,6%, Kospi recua 0,27%, Samsung contraria tendência e sobe quase 1%TradingKey - Em 29 de setembro, os mercados acionários do Japão e da Coreia do Sul mantiveram-se fracos no pregão da tarde, com o aumento do sentimento de cautela no mercado. O índice Nikkei 225 do Ja
Autor  TradingKey
Ontem 09: 19
TradingKey - Em 29 de setembro, os mercados acionários do Japão e da Coreia do Sul mantiveram-se fracos no pregão da tarde, com o aumento do sentimento de cautela no mercado. O índice Nikkei 225 do Ja
placeholder
Ações do Japão e da Coreia do Sul recuam enquanto Kospi cai 2,7%, Samsung e SK Hynix caem mais de 5% e Kioxia recua mais de 4%TradingKey - Em 28 de setembro, os mercados de ações do Japão e da Coreia do Sul caíram em conjunto, com as perdas no mercado sul-coreano se ampliando significativamente. O índice KOSPI da Coreia do S
Autor  TradingKey
9 Mês 28 Dia Seg
TradingKey - Em 28 de setembro, os mercados de ações do Japão e da Coreia do Sul caíram em conjunto, com as perdas no mercado sul-coreano se ampliando significativamente. O índice KOSPI da Coreia do S
Produtos relacionados
goTop
quote