
Australian Dollar appreciates after Trade Balance data, RBA Bullock’s speech awaited
- The Australian Dollar continues to face downward pressure following the release of Trade Balance data on Thursday.
- Australia’s Trade Balance posted a surplus of 6,009 million MoM in July, against the expected 5,150 million.
- The US Dollar received downward pressure following recent downbeat economic data.
The Australian Dollar (AUD) inches higher against the US Dollar (USD) following the release of the Trade Balance data on Thursday. Australia’s trade surplus widened to 6,009 million MoM in July, exceeding the expected 5,150 million and 5,589 million in the previous reading. Traders await Reserve Bank of Australia (RBA) Governor Michele Bullock’s speech later in the day.
The Australian Dollar received downward pressure as recent figures showed that Australia’s Gross Domestic Product (GDP) grew in the second quarter but fell short of the market expectations. A private survey also showed that the country’s manufacturing activity remained contractionary in August, extending the sector’s deterioration to two years.
The US Dollar depreciated after July's US JOLTS Job Openings came in below expectations, signaling a further slowdown in the labor market. Additionally, the ISM Manufacturing PMI showed that factory activity contracted for the fifth straight month.
Traders now await US ISM Services PMI and Initial Jobless Claims scheduled to be released on Thursday. Attention will shift to Friday’s US Nonfarm Payrolls (NFP) to gain more cues on the potential size of an expected rate cut by the Fed this month.
Daily Digest Market Movers: Australian Dollar appreciates due to widened trade surplus
- Atlanta Federal Reserve President Raphael Bostic said on Wednesday that the Fed is in a favorable position but added that they must not maintain a restrictive policy stance for too long, per Reuters. FXStreet’s FedTracker, which gauges the tone of Fed officials’ speeches on a dovish-to-hawkish scale from 0 to 10 using a custom AI model, rated Bostic’s words as neutral with a score of 4.6.
- US JOLTS Job Openings dropped to 7.673 million in July, down from 7.910 million in June, marking the lowest level since January 2021 and falling short of market expectations of 8.10 million.
- Bank of America (BoA) has revised its economic growth forecast for China, lowering its 2024 projection to 4.8% from the previous 5.0%. For 2025, the forecast is adjusted to 4.5% growth, while the 2026 outlook remains unchanged at 4.5%.
- China's Services Purchasing Managers' Index (PMI) fell from 52.1 in July to 51.6 in August, which is notable considering the close trade relationship between China and Australia.
- Australia’s Gross Domestic Product (GDP) posted a 0.2% reading QoQ for the second quarter, up from the previous quarter’s 0.1% but falling short of the expected 0.3% readings.
- The Judo Bank Composite PMI climbed to 51.7 in August, up from 51.4 in July, signaling the fastest expansion in three months. This growth was primarily fueled by a rise in services activity, with the Services PMI reaching 52.5 in August, up from 52.2 in July, marking the seventh consecutive month of growth in the services sector.
- The US ISM Manufacturing PMI inched up to 47.2 in August from 46.8 in July, falling short of market expectations of 47.5. This marks the 21st contraction in US factory activity over the past 22 months.
Technical Analysis: Australian Dollar holds ground above 0.6700
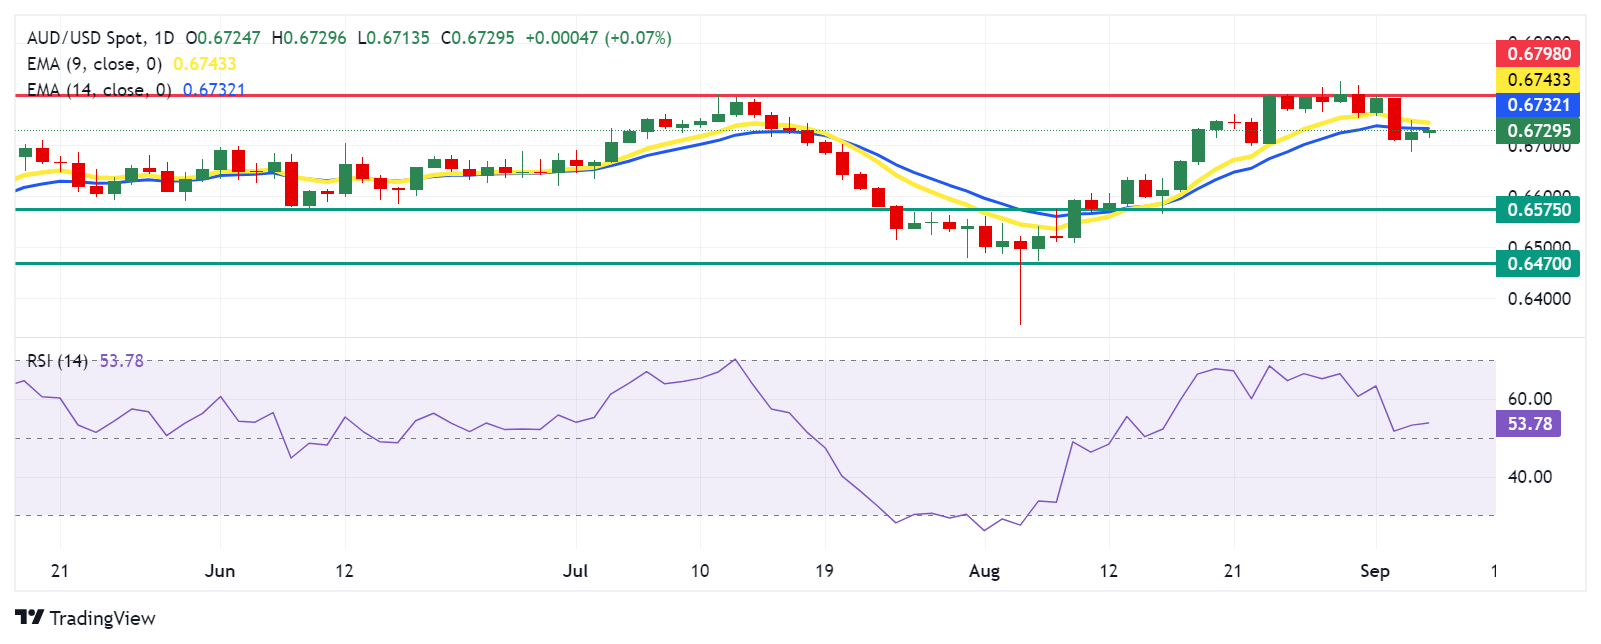
The Australian Dollar trades around 0.6720 on Thursday. Analyzing the daily chart, the AUD/USD pair is positioned below the nine-day Exponential Moving Average (EMA), suggesting a short-term bearish trend. However, the 14-day Relative Strength Index (RSI) has moved above the 50 level, suggesting that the asset price is leaning toward the bullish side.
On the downside, the AUD/USD pair could test the throwback level near 0.6575, with a deeper decline potentially aiming for the lower support around 0.6470.
In terms of resistance, the AUD/USD pair may first encounter the immediate barrier at the 14-day EMA around 0.6731, followed by the nine-day EMA at 0.6742. A break above these levels could pave the way for a test of the seven-month high at 0.6798.
AUD/USD: Daily Chart
Australian Dollar PRICE Today
The table below shows the percentage change of Australian Dollar (AUD) against listed major currencies today. Australian Dollar was the strongest against the Swiss Franc.
| USD | EUR | GBP | JPY | CAD | AUD | NZD | CHF | |
|---|---|---|---|---|---|---|---|---|
| USD | 0.00% | -0.07% | -0.01% | -0.01% | -0.09% | -0.01% | 0.04% | |
| EUR | 0.00% | -0.05% | -0.02% | 0.00% | -0.08% | 0.04% | 0.04% | |
| GBP | 0.07% | 0.05% | 0.04% | 0.08% | -0.02% | 0.09% | 0.09% | |
| JPY | 0.01% | 0.02% | -0.04% | 0.00% | -0.09% | -0.00% | 0.05% | |
| CAD | 0.01% | -0.01% | -0.08% | -0.01% | -0.07% | 0.02% | 0.04% | |
| AUD | 0.09% | 0.08% | 0.02% | 0.09% | 0.07% | 0.10% | 0.12% | |
| NZD | 0.00% | -0.04% | -0.09% | 0.00% | -0.02% | -0.10% | 0.02% | |
| CHF | -0.04% | -0.04% | -0.09% | -0.05% | -0.04% | -0.12% | -0.02% |
The heat map shows percentage changes of major currencies against each other. The base currency is picked from the left column, while the quote currency is picked from the top row. For example, if you pick the Australian Dollar from the left column and move along the horizontal line to the US Dollar, the percentage change displayed in the box will represent AUD (base)/USD (quote).
Australian Dollar FAQs
One of the most significant factors for the Australian Dollar (AUD) is the level of interest rates set by the Reserve Bank of Australia (RBA). Because Australia is a resource-rich country another key driver is the price of its biggest export, Iron Ore. The health of the Chinese economy, its largest trading partner, is a factor, as well as inflation in Australia, its growth rate and Trade Balance. Market sentiment – whether investors are taking on more risky assets (risk-on) or seeking safe-havens (risk-off) – is also a factor, with risk-on positive for AUD.
The Reserve Bank of Australia (RBA) influences the Australian Dollar (AUD) by setting the level of interest rates that Australian banks can lend to each other. This influences the level of interest rates in the economy as a whole. The main goal of the RBA is to maintain a stable inflation rate of 2-3% by adjusting interest rates up or down. Relatively high interest rates compared to other major central banks support the AUD, and the opposite for relatively low. The RBA can also use quantitative easing and tightening to influence credit conditions, with the former AUD-negative and the latter AUD-positive.
China is Australia’s largest trading partner so the health of the Chinese economy is a major influence on the value of the Australian Dollar (AUD). When the Chinese economy is doing well it purchases more raw materials, goods and services from Australia, lifting demand for the AUD, and pushing up its value. The opposite is the case when the Chinese economy is not growing as fast as expected. Positive or negative surprises in Chinese growth data, therefore, often have a direct impact on the Australian Dollar and its pairs.
Iron Ore is Australia’s largest export, accounting for $118 billion a year according to data from 2021, with China as its primary destination. The price of Iron Ore, therefore, can be a driver of the Australian Dollar. Generally, if the price of Iron Ore rises, AUD also goes up, as aggregate demand for the currency increases. The opposite is the case if the price of Iron Ore falls. Higher Iron Ore prices also tend to result in a greater likelihood of a positive Trade Balance for Australia, which is also positive of the AUD.
The Trade Balance, which is the difference between what a country earns from its exports versus what it pays for its imports, is another factor that can influence the value of the Australian Dollar. If Australia produces highly sought after exports, then its currency will gain in value purely from the surplus demand created from foreign buyers seeking to purchase its exports versus what it spends to purchase imports. Therefore, a positive net Trade Balance strengthens the AUD, with the opposite effect if the Trade Balance is negative.
Artigos Recomendados


