

USD/JPY Price Analysis: Technicals suggest further downside seen
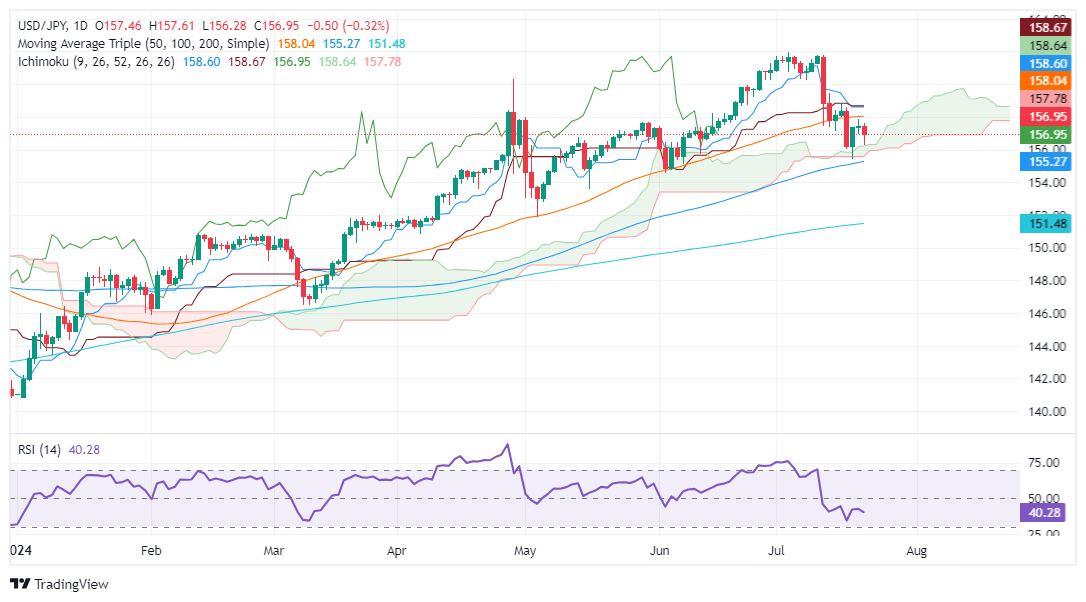
- USD/JPY trades below 157.00, near the Ichimoku Cloud’s narrowest top, signaling potential downside.
- Technical indicators show bearish momentum: Tenkan-Sen below Kijun-Sen, Chikou Span piercing below price action.
- Key support levels: 156.28 (July 22 low), 155.90/156.00 (Kumo bottom), 155.37 (July 18 low).
The USD/JPY registered losses of more than 0.20% on Monday, remaining near the top of the narrowest part of the Ichimoku Cloud (Kumo) as traders eye further downside. As Tuesday’s Asian session begins, the pair trades at 156.96, virtually unchanged.
USD/JPY Price Analysis: Technical outlook
From a technical perspective, the USD/JPY is neutral to downward biased as more bearish technical signals emerge. This, alongside releasing a deceleration of inflation, could weigh on the Greenback and push the spot price lower. Momentum suggests that sellers are in control, opening the door for further downside.
The crossing of the Tenkan-Sen below the Kijun-Sen and the Chikou Span piercing below price action are the leading signals that warned traders that the pair’s trend could change.
If USD/JPY drops below the July 22 low of 156.28, that would pave the way for further downside. The next support would be the bottom of the Kumo at around 155.90/156.00, followed by the July 18 test at 155.37. on additional weakness, the pair would aim toward the June 4 daily low of 154.55.
Conversely, if USD/JPY climbs past the latest cycle peak at 157.86, the next resistance would be 158.00. Further gains are seen, but buyers will clash with the Tenkan-Sen, coinciding with the Kijun-Sen at around 156.58.
USD/JPY Price Action – Daily Chart
Japanese Yen FAQs
The Japanese Yen (JPY) is one of the world’s most traded currencies. Its value is broadly determined by the performance of the Japanese economy, but more specifically by the Bank of Japan’s policy, the differential between Japanese and US bond yields, or risk sentiment among traders, among other factors.
One of the Bank of Japan’s mandates is currency control, so its moves are key for the Yen. The BoJ has directly intervened in currency markets sometimes, generally to lower the value of the Yen, although it refrains from doing it often due to political concerns of its main trading partners. The current BoJ ultra-loose monetary policy, based on massive stimulus to the economy, has caused the Yen to depreciate against its main currency peers. This process has exacerbated more recently due to an increasing policy divergence between the Bank of Japan and other main central banks, which have opted to increase interest rates sharply to fight decades-high levels of inflation.
The BoJ’s stance of sticking to ultra-loose monetary policy has led to a widening policy divergence with other central banks, particularly with the US Federal Reserve. This supports a widening of the differential between the 10-year US and Japanese bonds, which favors the US Dollar against the Japanese Yen.
The Japanese Yen is often seen as a safe-haven investment. This means that in times of market stress, investors are more likely to put their money in the Japanese currency due to its supposed reliability and stability. Turbulent times are likely to strengthen the Yen’s value against other currencies seen as more risky to invest in.
Artigos Recomendados


