
NZD/JPY Price Analysis: Buyers retreat after scaling to decades-high peak near 99.00
- NZD/JPY experiences a slight retreat, moving towards the 98.60 mark.
- Immediately identifiable supports are established at 98.00 and 97.00.
- In its ongoing traverse of unexplored territories, the pair could potentially test the 99.00-100.00 range.
In the Thursday trading session, the NZD/JPY pair witnessed a subtle downturn, moving towards the 98.60 level. This comes after buyers paused their aggressive move, having recently elevated the pair to highs unseen in decades, peaking near the 99.00 mark.
From the perspective of the daily chart's technical analysis, the Relative Strength Index (RSI) presently records a reading of 70, marking a slight decrease from Wednesday's session's reading. This mild decline indicates a possible decline in the previously strong bullish momentum. However, with the RSI still relatively high, the bullish momentum cannot be disregarded entirely. The Moving Average Convergence Divergence (MACD) appears in flat green bars, reinforcing arguments suggesting overextended movements and a potential pullback.
NZD/JPY daily chart
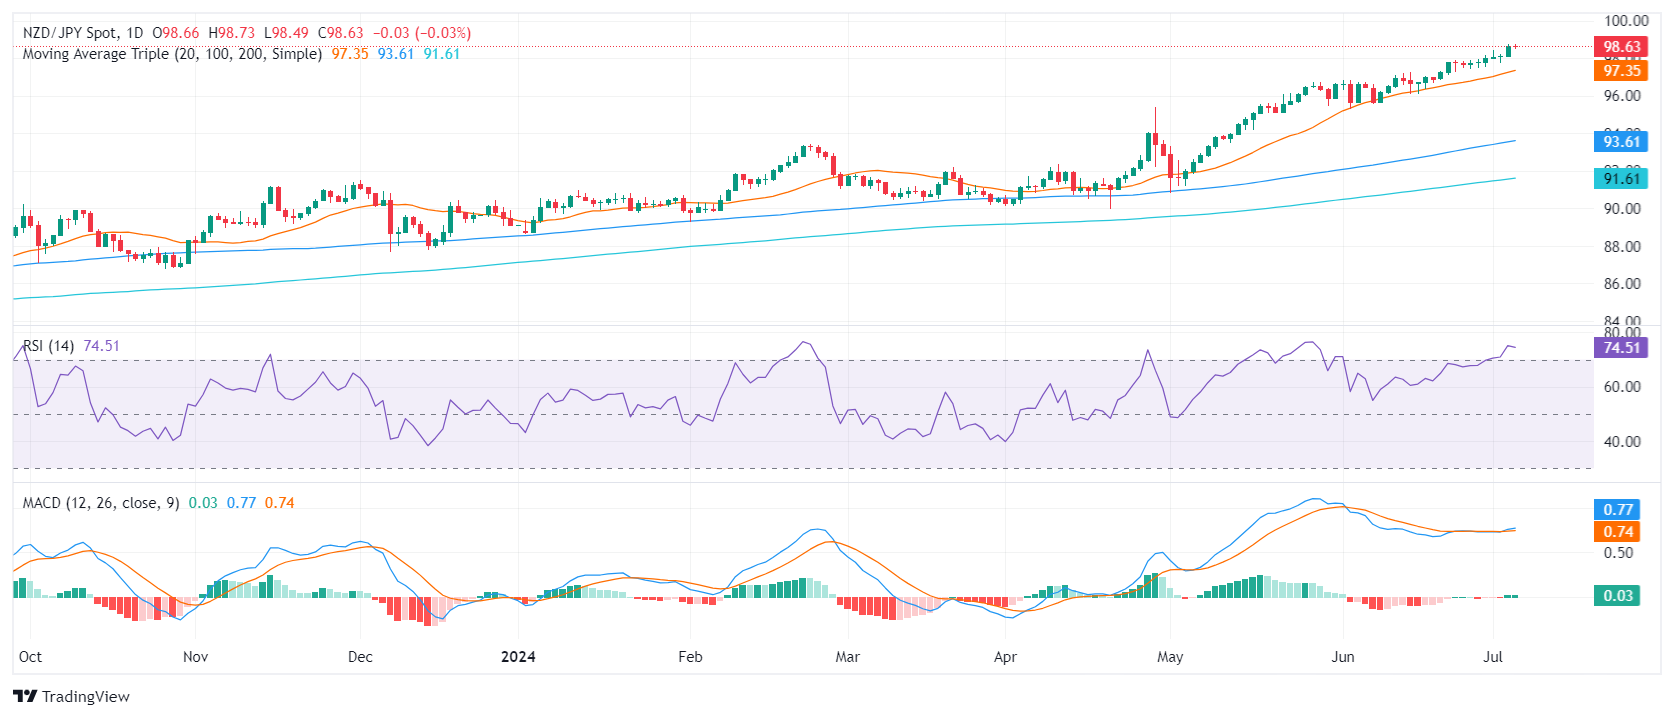
Moving forward, it is expected that the pair could maintain its bullish trajectory, remaining above the 20-day, 100-day, and 200-day Simple Moving Averages (SMAs). Nevertheless, potential corrections related to the current overbought situations could be in sight.
In case of a downward correction, immediate support is now anticipated around 98.00, 97.50, and 97.30 (20-day SMA). Buyers should prioritize maintaining these levels before seeking to explore new highs. If the 98.00 level successfully withstands the defensive play, buyers might retest the 99.00 area and even the 100.00 levels.
Artigos Recomendados


