GBP/USD Price Analysis: Subdued despite climbing above 1.2700

Fonte Fxstreet
  • GBP/USD jumps above 1.2700 on softer US data, yet the pair remains sideways.
  • Key resistance emerges at 1.2761, 1.2800, and the YTD high near 1.2900.
  • Support is seen at 1.2700, 1.2674, and the confluence of May 3 high and 100-DMA.

The British Pound erases some of its previous losses against the US Dollar and rises some 0.29%, as the GBP/USD aims above 1.2700 after bouncing off a daily low of 1.2674. Data from the United States (US) was cheered by market participants and weighed on the safe-haven peers, like the Greenback.

GBP/USD Price Analysis: Technical outlook

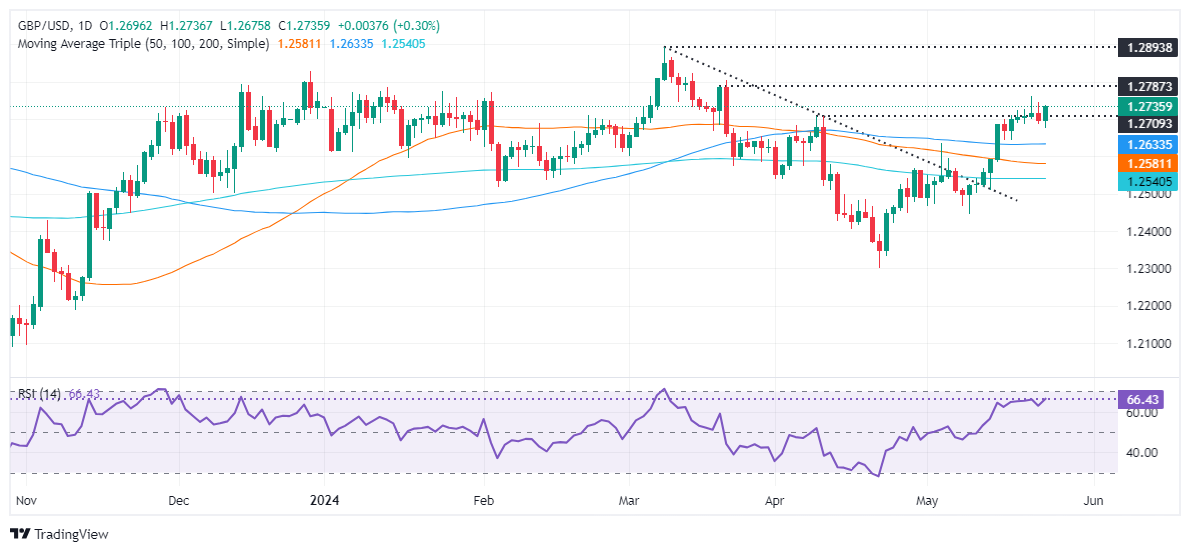
The GBP/USD remains in consolidation, within the 1.2670-1.2760 during the week, unable to decisively breach the range. Still, buyers remain in charge as depicted by the Relative Strength Index (RSI) standing in bullish territory, yet almost flat.

For a bullish continuation, the major should clear 1.2760, which will expose the 1.2800 figure. Further strength would pave the way to test a year-to-date (YTD) high of 1.2893, followed by 1.2900.

Conversely, if bears stepped in, they must clear 1.2700 and the May 23 low of 1.2674. In that event, the Bulls’ next line of defense would be the confluence of the 100-day moving average (DMA) and the May 3 high-turned support at 1.2634 before the GBP/USD tumbles to 1.2600.

GBP/USD Price Action – Daily Chart
GBP/USD

Overview
Today last price 1.2734
Today Daily Change 0.0036
Today Daily Change % 0.28
Today daily open 1.2698
 
Trends
Daily SMA20 1.2591
Daily SMA50 1.2581
Daily SMA100 1.2633
Daily SMA200 1.2541
 
Levels
Previous Daily High 1.2747
Previous Daily Low 1.2686
Previous Weekly High 1.2712
Previous Weekly Low 1.2509
Previous Monthly High 1.2709
Previous Monthly Low 1.23
Daily Fibonacci 38.2% 1.2709
Daily Fibonacci 61.8% 1.2723
Daily Pivot Point S1 1.2674
Daily Pivot Point S2 1.2649
Daily Pivot Point S3 1.2612
Daily Pivot Point R1 1.2735
Daily Pivot Point R2 1.2771
Daily Pivot Point R3 1.2796


British Pound PRICE Today

The table below shows the percentage change of British Pound (GBP) against listed major currencies today. British Pound was the strongest against the Japanese Yen.

  USD EUR GBP JPY CAD AUD NZD CHF
USD   -0.31% -0.31% 0.05% -0.41% -0.29% -0.25% 0.02%
EUR 0.31%   0.00% 0.32% -0.13% 0.01% 0.06% 0.32%
GBP 0.31% -0.00%   0.32% -0.12% 0.03% 0.05% 0.31%
JPY -0.05% -0.32% -0.32%   -0.43% -0.32% -0.28% -0.03%
CAD 0.41% 0.13% 0.12% 0.43%   0.11% 0.17% 0.42%
AUD 0.29% -0.01% -0.03% 0.32% -0.11%   0.03% 0.30%
NZD 0.25% -0.06% -0.05% 0.28% -0.17% -0.03%   0.25%
CHF -0.02% -0.32% -0.31% 0.03% -0.42% -0.30% -0.25%  

The heat map shows percentage changes of major currencies against each other. The base currency is picked from the left column, while the quote currency is picked from the top row. For example, if you pick the British Pound from the left column and move along the horizontal line to the US Dollar, the percentage change displayed in the box will represent GBP (base)/USD (quote).


Isenção de responsabilidade: Apenas para fins informativos. O desempenho passado não é indicativo de resultados futuros.
placeholder
O preço do ouro atinge um recorde de alta, com o aumento das tensões geopolíticas em focoO preço do ouro (XAU/USD) ganha impulso na segunda-feira. O metal amarelo atingiu um recorde de alta próximo a US$ 2.441 durante a sessão asiática de segunda-feira, em meio a esperanças renovadas de cortes nas taxas de juros do Federal Reserve (Fed) dos EUA e ao aumento das tensões geopolíticas no Oriente Médio.
Autor  FXStreet
5 Mês 20 Dia Seg
O preço do ouro (XAU/USD) ganha impulso na segunda-feira. O metal amarelo atingiu um recorde de alta próximo a US$ 2.441 durante a sessão asiática de segunda-feira, em meio a esperanças renovadas de cortes nas taxas de juros do Federal Reserve (Fed) dos EUA e ao aumento das tensões geopolíticas no Oriente Médio.
placeholder
Até onde o ouro pode subir este ano? Veja o que diz este especialistaInvesting.com – Com a divulgação dos mais recentes índices de inflação, os investidores do ouro permanecem atentos à direção futura dos preços do metal precioso.Embora a expectativa geral seja de que
Autor  Investing.com
6 Mês 14 Dia Sex
Investing.com – Com a divulgação dos mais recentes índices de inflação, os investidores do ouro permanecem atentos à direção futura dos preços do metal precioso.Embora a expectativa geral seja de que
placeholder
VALE3 Vale a Pena Comprar Ações da VALE? Análise Técnica GráficaNo vídeo "VALE3 Vale a Pena Comprar Ações da VALE? Análise Técnica Gráfica" teremos a oportunidade de ver uma análise técnica / análise gráfica das ações VALE3 e também do minério de ferro negociado na bolsa chinesa.
Autor  Roberto Fernandes
6 Mês 17 Dia Seg
No vídeo "VALE3 Vale a Pena Comprar Ações da VALE? Análise Técnica Gráfica" teremos a oportunidade de ver uma análise técnica / análise gráfica das ações VALE3 e também do minério de ferro negociado na bolsa chinesa.
placeholder
UBS enxerga recuperação das commodities mesmo com receios sobre demandaInvesting.com – Mesmo com receios e incertezas a respeito da demanda global, as commodities devem apresentar tendência de recuperação, disseram especialistas do banco UBS em relatório divulgado a clie
Autor  Investing.com
7 Mês 25 Dia Qui
Investing.com – Mesmo com receios e incertezas a respeito da demanda global, as commodities devem apresentar tendência de recuperação, disseram especialistas do banco UBS em relatório divulgado a clie
placeholder
UBS BB inicia cobertura de Banrisul com indicação neutraInvesting.com – Analistas do UBS BB iniciaram a cobertura das ações do Banrisul (BVMF:BRSR6) com recomendação neutra e preço-alvo de R$14. O tradicional banco regional estaria enfrentando novo desafio
Autor  Investing.com
7 Mês 31 Dia Qua
Investing.com – Analistas do UBS BB iniciaram a cobertura das ações do Banrisul (BVMF:BRSR6) com recomendação neutra e preço-alvo de R$14. O tradicional banco regional estaria enfrentando novo desafio
Produtos relacionados
goTop
quote