USD/CHF Price Analysis: Trades close to six-month high around 0.9150

Fonte Fxstreet
  • USD/CHF oscillates near a six-month high around 0.9150, exhibiting strength ahead of crucial US data.
  • The SNB is expected to extend the rate-cut cycle in June.
  • The Fed sees the current interest rate policy framework as appropriate.

The USD/CHF pair hovers around the six-month high of 0.9150 in Wednesday’s early American session. The near-term outlook of the Swiss Franc asset remains bullish, with expectations of further escalation in policy divergence between the Federal Reserve (Fed) and the Swiss National Bank (SNB).

The Fed is expected to keep interest rates at their current levels for a longer period, given the strength in the United States labor market and stubbornly higher inflation due to strong consumer spending.

The SNB will reduce interest rates again in the June policy meeting. The SNB kicked off the global rate-cut cycle after lowering borrowing rates by 25 basis points (bps) to 1.5% in the March meeting. The inflation in the Swiss economy has softened below the 2% target from a longer period, allowing the SNB to slice key interest rates further.

Meanwhile, investors await the crucial US Q1 Gross Domestic Product (GDP) and the core Personal Consumption Expenditure Price Index (PCE) data for March, which will be published on Thursday and Friday. The economic data will impact market expectations for Fed rate cuts, which are currently expected in the September meeting.

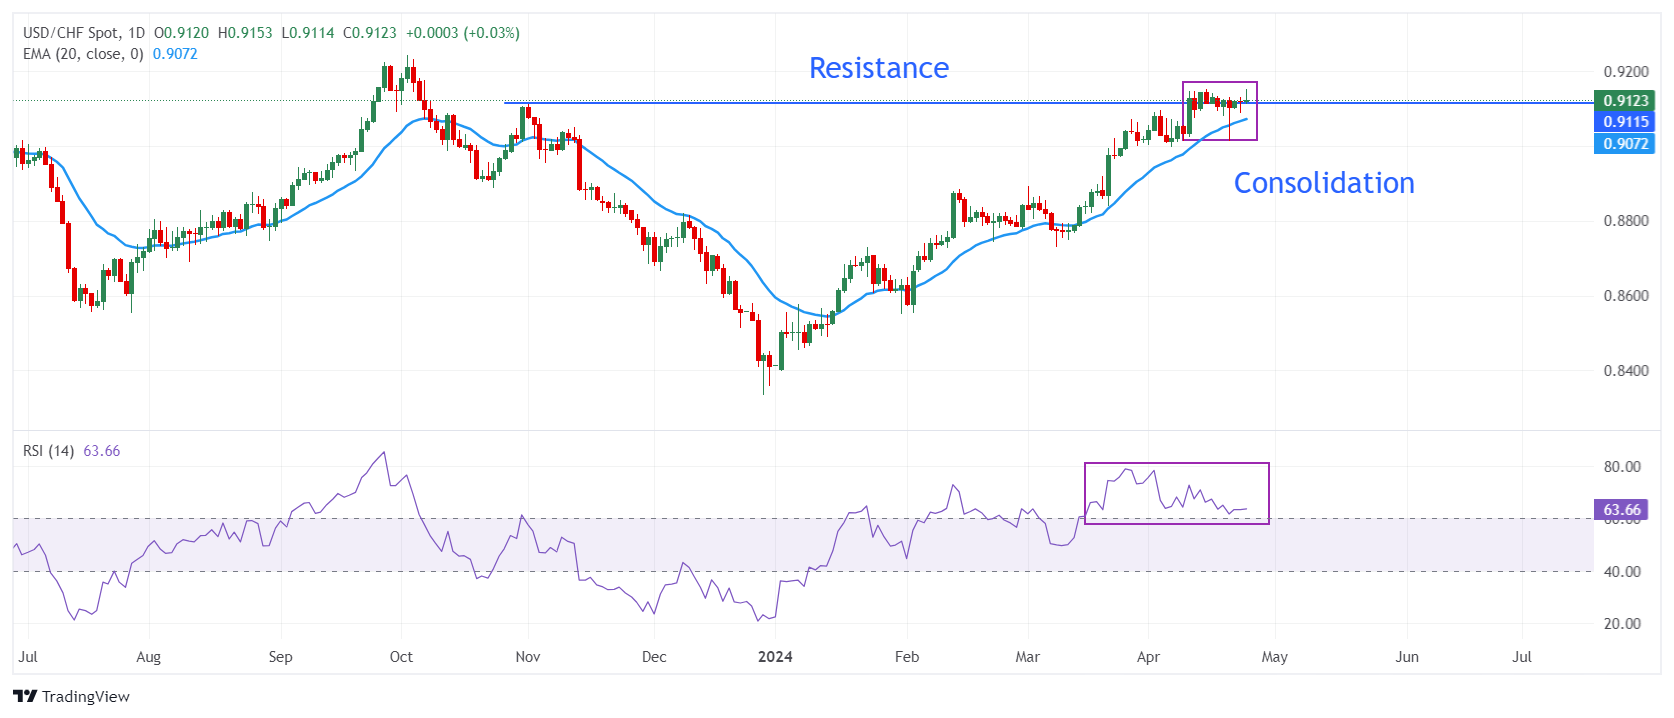
USD/CHF trades back-and-forth in a tight range near the crucial resistance of 0.9110, which is plotted from 1 November 2023 high plotted on a daily timeframe. The asset is expected to extend its upside as the upward-sloping 20-day Exponential Moving Average (EMA) near 0.9075 suggests an upbeat near-term outlook.

The 14-period Relative Strength Index (RSI) oscillates in the bullish range of 60.00-80.00, indicating that a bullish momentum is still active.

Going forward, an upside move above intraday high of 0.9153 will drive the asset towards the round-level support of 0.9200. A breach of the latter will push the asset further to 4 October 2023 high at 0.9232.

In an alternate scenario, fresh downside would appear if the asset breaks below the psychological support of 0.9000, which will expose it to March 22 low at 0.8966, followed by March 1 high at 0.8893.

USD/CHF daily chart
USD/CHF

Overview
Today last price 0.9125
Today Daily Change 0.0005
Today Daily Change % 0.05
Today daily open 0.912
 
Trends
Daily SMA20 0.9077
Daily SMA50 0.8936
Daily SMA100 0.878
Daily SMA200 0.8839
 
Levels
Previous Daily High 0.913
Previous Daily Low 0.9087
Previous Weekly High 0.9152
Previous Weekly Low 0.9012
Previous Monthly High 0.9072
Previous Monthly Low 0.873
Daily Fibonacci 38.2% 0.9104
Daily Fibonacci 61.8% 0.9114
Daily Pivot Point S1 0.9095
Daily Pivot Point S2 0.9069
Daily Pivot Point S3 0.9051
Daily Pivot Point R1 0.9138
Daily Pivot Point R2 0.9156
Daily Pivot Point R3 0.9181


Isenção de responsabilidade: Apenas para fins informativos. O desempenho passado não é indicativo de resultados futuros.
placeholder
O preço do ouro atinge um recorde de alta, com o aumento das tensões geopolíticas em focoO preço do ouro (XAU/USD) ganha impulso na segunda-feira. O metal amarelo atingiu um recorde de alta próximo a US$ 2.441 durante a sessão asiática de segunda-feira, em meio a esperanças renovadas de cortes nas taxas de juros do Federal Reserve (Fed) dos EUA e ao aumento das tensões geopolíticas no Oriente Médio.
Autor  FXStreet
5 Mês 20 Dia Seg
O preço do ouro (XAU/USD) ganha impulso na segunda-feira. O metal amarelo atingiu um recorde de alta próximo a US$ 2.441 durante a sessão asiática de segunda-feira, em meio a esperanças renovadas de cortes nas taxas de juros do Federal Reserve (Fed) dos EUA e ao aumento das tensões geopolíticas no Oriente Médio.
placeholder
Até onde o ouro pode subir este ano? Veja o que diz este especialistaInvesting.com – Com a divulgação dos mais recentes índices de inflação, os investidores do ouro permanecem atentos à direção futura dos preços do metal precioso.Embora a expectativa geral seja de que
Autor  Investing.com
6 Mês 14 Dia Sex
Investing.com – Com a divulgação dos mais recentes índices de inflação, os investidores do ouro permanecem atentos à direção futura dos preços do metal precioso.Embora a expectativa geral seja de que
placeholder
VALE3 Vale a Pena Comprar Ações da VALE? Análise Técnica GráficaNo vídeo "VALE3 Vale a Pena Comprar Ações da VALE? Análise Técnica Gráfica" teremos a oportunidade de ver uma análise técnica / análise gráfica das ações VALE3 e também do minério de ferro negociado na bolsa chinesa.
Autor  Roberto Fernandes
6 Mês 17 Dia Seg
No vídeo "VALE3 Vale a Pena Comprar Ações da VALE? Análise Técnica Gráfica" teremos a oportunidade de ver uma análise técnica / análise gráfica das ações VALE3 e também do minério de ferro negociado na bolsa chinesa.
placeholder
UBS enxerga recuperação das commodities mesmo com receios sobre demandaInvesting.com – Mesmo com receios e incertezas a respeito da demanda global, as commodities devem apresentar tendência de recuperação, disseram especialistas do banco UBS em relatório divulgado a clie
Autor  Investing.com
7 Mês 25 Dia Qui
Investing.com – Mesmo com receios e incertezas a respeito da demanda global, as commodities devem apresentar tendência de recuperação, disseram especialistas do banco UBS em relatório divulgado a clie
placeholder
UBS BB inicia cobertura de Banrisul com indicação neutraInvesting.com – Analistas do UBS BB iniciaram a cobertura das ações do Banrisul (BVMF:BRSR6) com recomendação neutra e preço-alvo de R$14. O tradicional banco regional estaria enfrentando novo desafio
Autor  Investing.com
7 Mês 31 Dia Qua
Investing.com – Analistas do UBS BB iniciaram a cobertura das ações do Banrisul (BVMF:BRSR6) com recomendação neutra e preço-alvo de R$14. O tradicional banco regional estaria enfrentando novo desafio
Produtos relacionados
goTop
quote