Silver Price Analysis: Silver price finds floor but is still at risk of more weakness

Fonte Fxstreet
  • Silver price finds support at $26.70 but remains at risk of further weakness. 
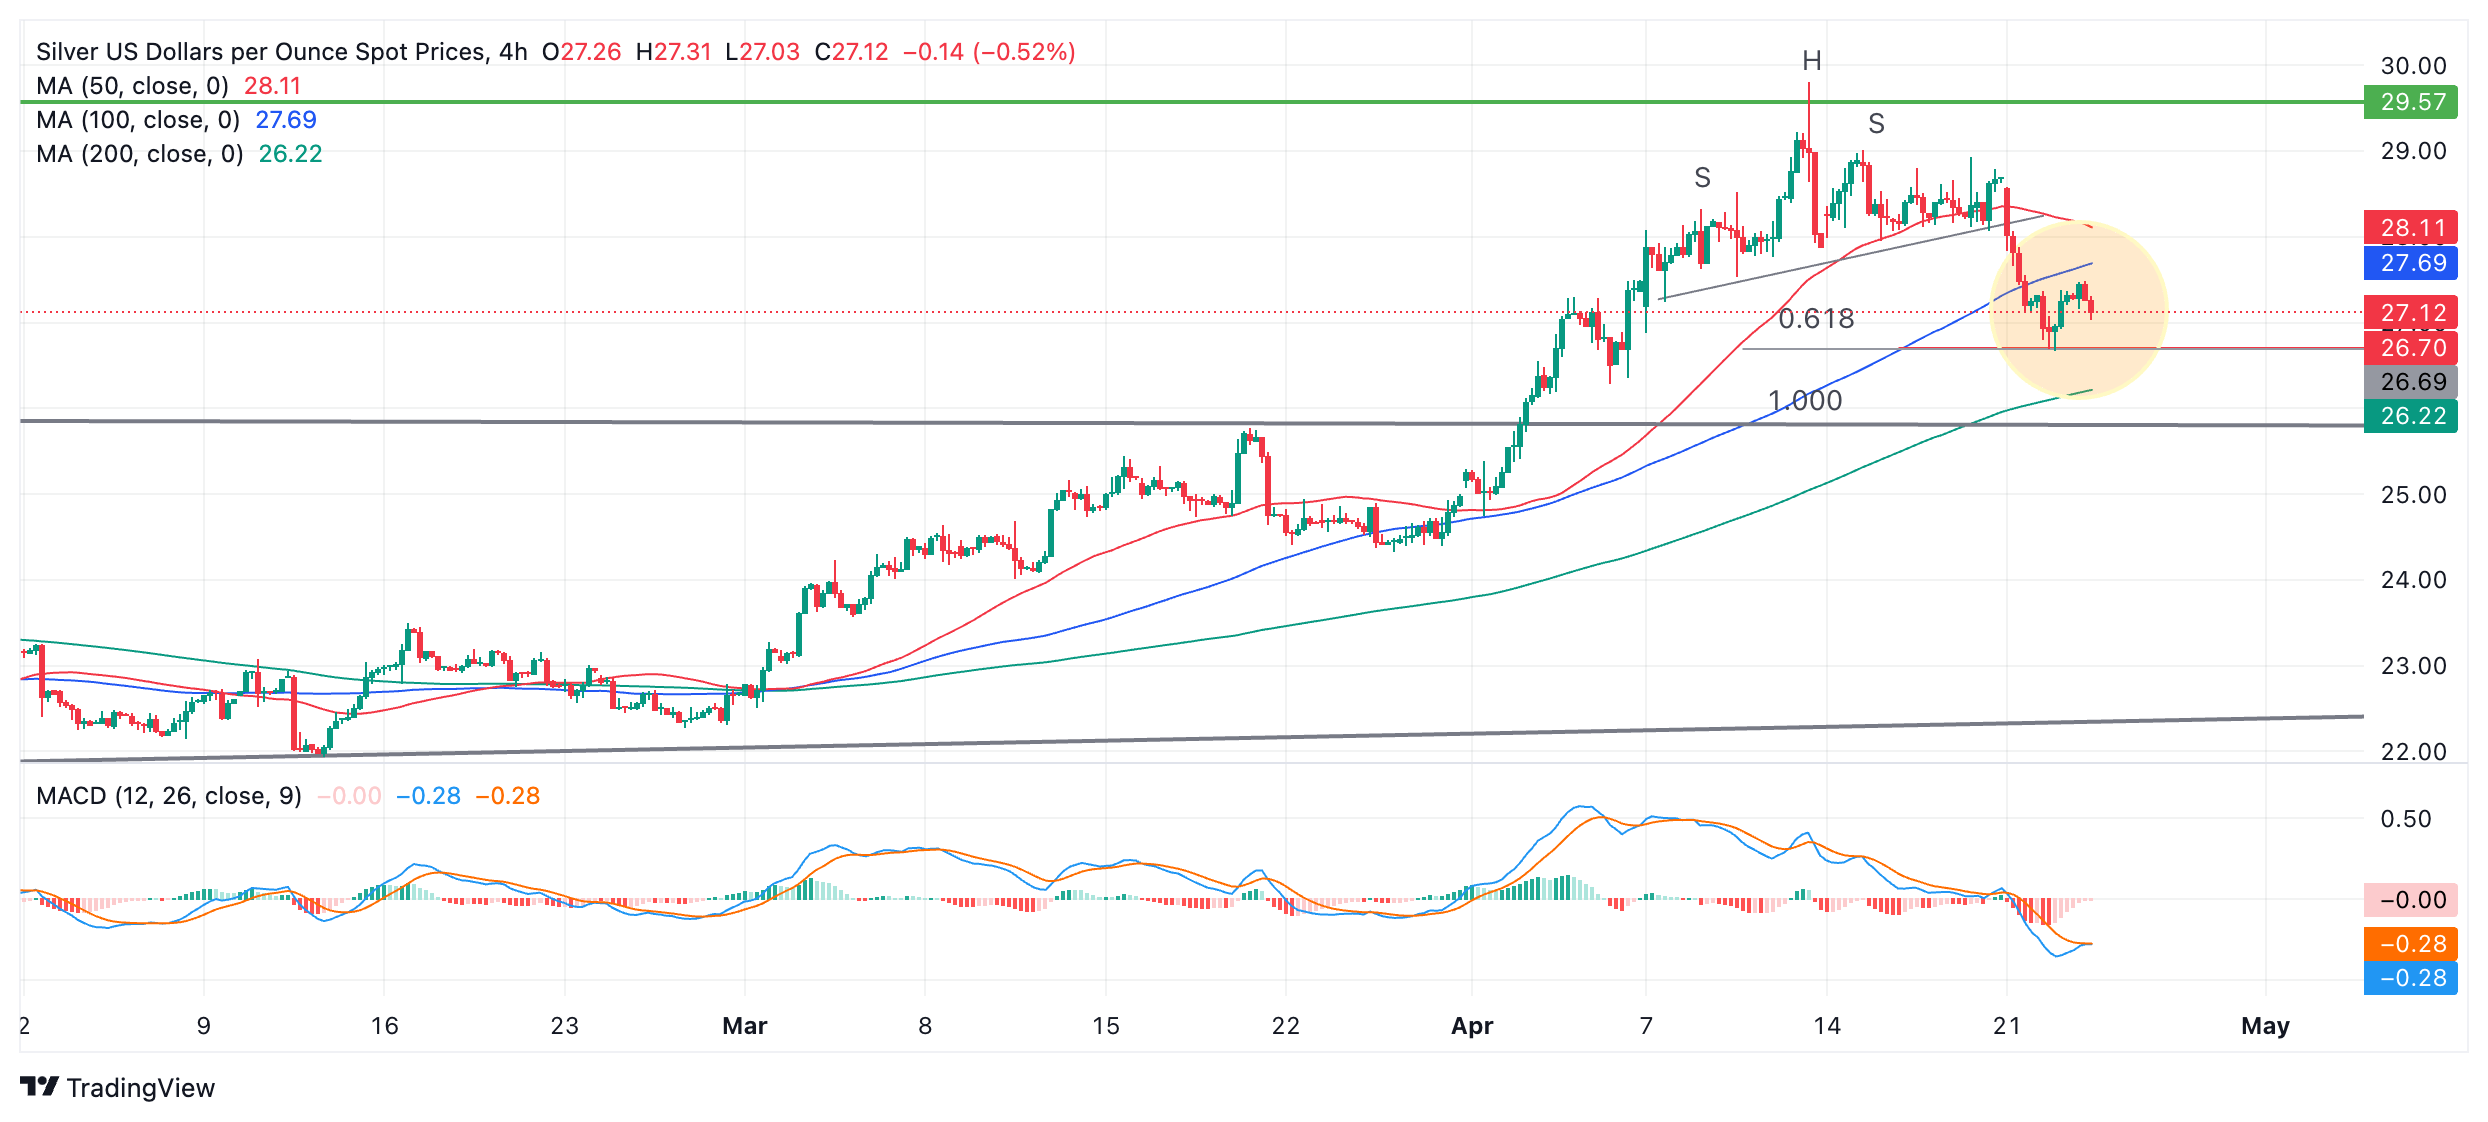
  • It formed a pattern on the 4-hour chart after touching the top of a four-year consolidation at $30.00. 
  • XAG/USD has fallen to an initial target but is vulnerable to further declines –  support is at $25.80. 

Silver (XAG/USD) price has found a floor at $26.70 and is consolidating. This follows a sell off that reversed the short-term uptrend after Silver was rejected by the top of a long-term range at just below $30.00 (green line).

The precious metal formed a bullish Hammer candlestick pattern on the daily chart, on Tuesday (circled below).

Silver Daily Chart
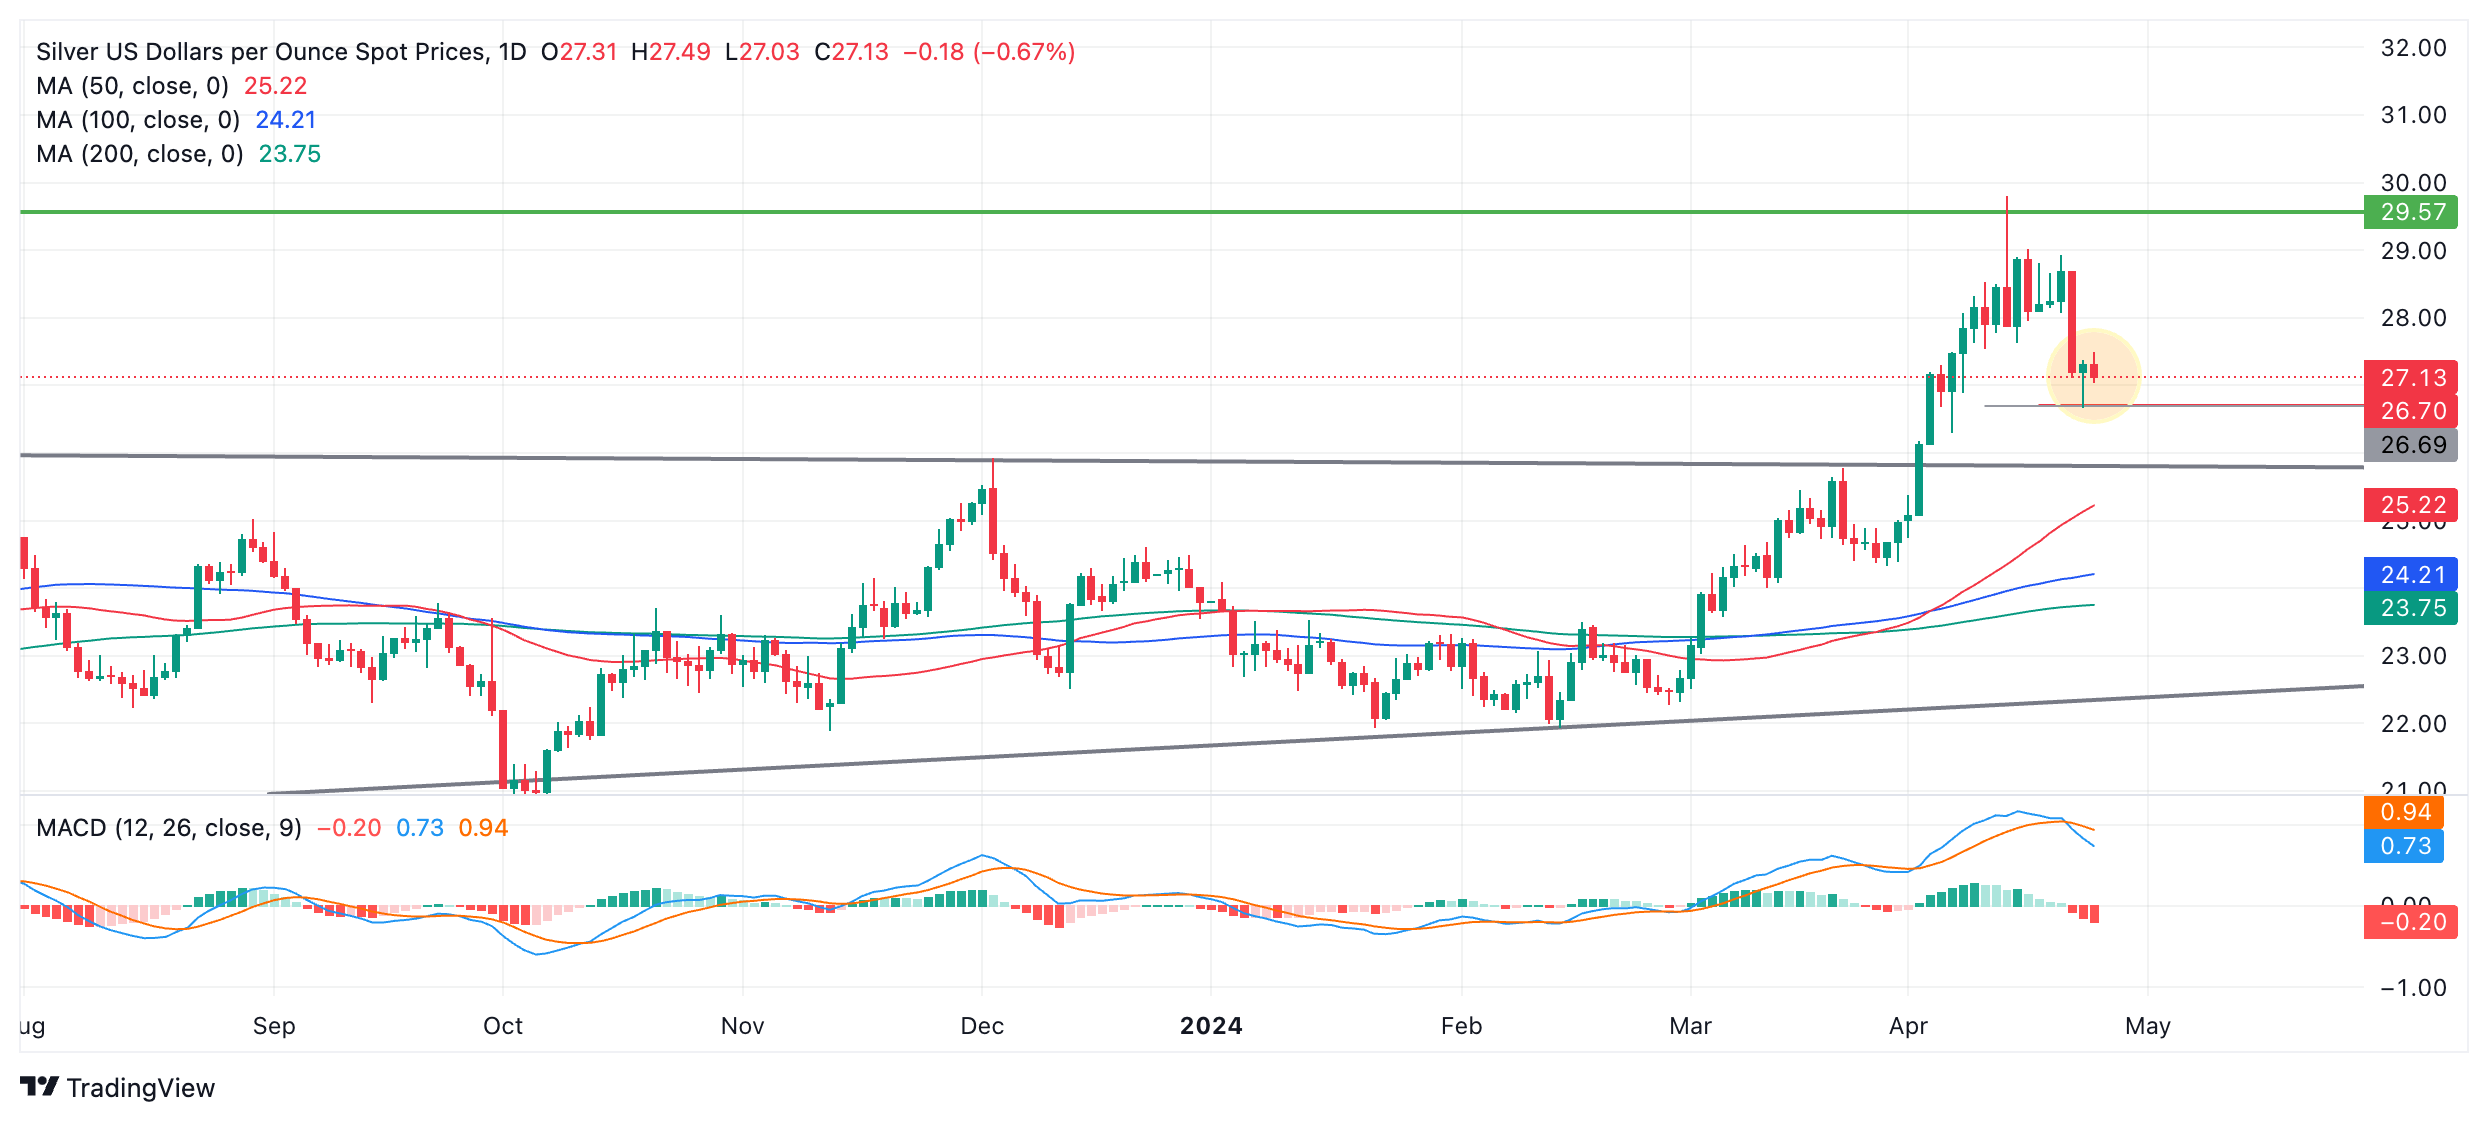
If the Hammer is followed by a green up candle on Wednesday confirming the bullish change in sentiment, it could signal a possible short-term correction higher. If not Silver price is at risk of more downside. A break below the low of the hammer would provide confirmation of more weakness. The next downside target would probably be at support from the top of the year-long range at around $25.80.

The Moving Average Convergence/Divergence (MACD) momentum indicator has crossed below its signal line, indicating more weakness is likely. The signal is reinforced by the fact that MACD has been proven to be a more reliable indicator in markets that are not strongly trending, such as is the case with Silver. 

A decisive break below $25.80 would return Silver to inside its year-long range and possibly the lower trendline at roughly $23.00. 

From a bullish perspective, a decisive break above the 2021 high of $30.07 would suggest Silver was going higher, with an initial target at $32.40 where former resistance lies. 

4-hour Chart 

The 4-hour chart which analysts often use to determine the short-term trend, shows in more detail the price dynamics that preceded the fall from the top of the four-year consolidation zone (green line).  

Silver price formed a multi-shouldered Head and Shoulders (H&S) topping pattern at the $30.00 highs of mid-April. 

When the pattern broke below its “neckline” at the base, at roughly $28.00, it fell sharply to an initial target at $26.70. This target is the conservative estimate for the pattern, calculated by taking the height of the H&S and extrapolating the distance by a 0.618 Fibonacci ratio from the neckline lower. 

If the pattern falls further to its optimistic target, which lies at the full distance of the height of the pattern extrapolated lower (Fib.1.000), it will reach a target at roughly the same level as the top of the year-long range at around $25.80.


Isenção de responsabilidade: Apenas para fins informativos. O desempenho passado não é indicativo de resultados futuros.
placeholder
O preço do ouro atinge um recorde de alta, com o aumento das tensões geopolíticas em focoO preço do ouro (XAU/USD) ganha impulso na segunda-feira. O metal amarelo atingiu um recorde de alta próximo a US$ 2.441 durante a sessão asiática de segunda-feira, em meio a esperanças renovadas de cortes nas taxas de juros do Federal Reserve (Fed) dos EUA e ao aumento das tensões geopolíticas no Oriente Médio.
Autor  FXStreet
5 Mês 20 Dia Seg
O preço do ouro (XAU/USD) ganha impulso na segunda-feira. O metal amarelo atingiu um recorde de alta próximo a US$ 2.441 durante a sessão asiática de segunda-feira, em meio a esperanças renovadas de cortes nas taxas de juros do Federal Reserve (Fed) dos EUA e ao aumento das tensões geopolíticas no Oriente Médio.
placeholder
Até onde o ouro pode subir este ano? Veja o que diz este especialistaInvesting.com – Com a divulgação dos mais recentes índices de inflação, os investidores do ouro permanecem atentos à direção futura dos preços do metal precioso.Embora a expectativa geral seja de que
Autor  Investing.com
6 Mês 14 Dia Sex
Investing.com – Com a divulgação dos mais recentes índices de inflação, os investidores do ouro permanecem atentos à direção futura dos preços do metal precioso.Embora a expectativa geral seja de que
placeholder
VALE3 Vale a Pena Comprar Ações da VALE? Análise Técnica GráficaNo vídeo "VALE3 Vale a Pena Comprar Ações da VALE? Análise Técnica Gráfica" teremos a oportunidade de ver uma análise técnica / análise gráfica das ações VALE3 e também do minério de ferro negociado na bolsa chinesa.
Autor  Roberto Fernandes
6 Mês 17 Dia Seg
No vídeo "VALE3 Vale a Pena Comprar Ações da VALE? Análise Técnica Gráfica" teremos a oportunidade de ver uma análise técnica / análise gráfica das ações VALE3 e também do minério de ferro negociado na bolsa chinesa.
placeholder
UBS enxerga recuperação das commodities mesmo com receios sobre demandaInvesting.com – Mesmo com receios e incertezas a respeito da demanda global, as commodities devem apresentar tendência de recuperação, disseram especialistas do banco UBS em relatório divulgado a clie
Autor  Investing.com
7 Mês 25 Dia Qui
Investing.com – Mesmo com receios e incertezas a respeito da demanda global, as commodities devem apresentar tendência de recuperação, disseram especialistas do banco UBS em relatório divulgado a clie
placeholder
UBS BB inicia cobertura de Banrisul com indicação neutraInvesting.com – Analistas do UBS BB iniciaram a cobertura das ações do Banrisul (BVMF:BRSR6) com recomendação neutra e preço-alvo de R$14. O tradicional banco regional estaria enfrentando novo desafio
Autor  Investing.com
7 Mês 31 Dia Qua
Investing.com – Analistas do UBS BB iniciaram a cobertura das ações do Banrisul (BVMF:BRSR6) com recomendação neutra e preço-alvo de R$14. O tradicional banco regional estaria enfrentando novo desafio
Produtos relacionados
goTop
quote