NZD/USD Price Analysis: Bears hold sway, subtle signs of potential bullish reversal emerging

Fonte Fxstreet
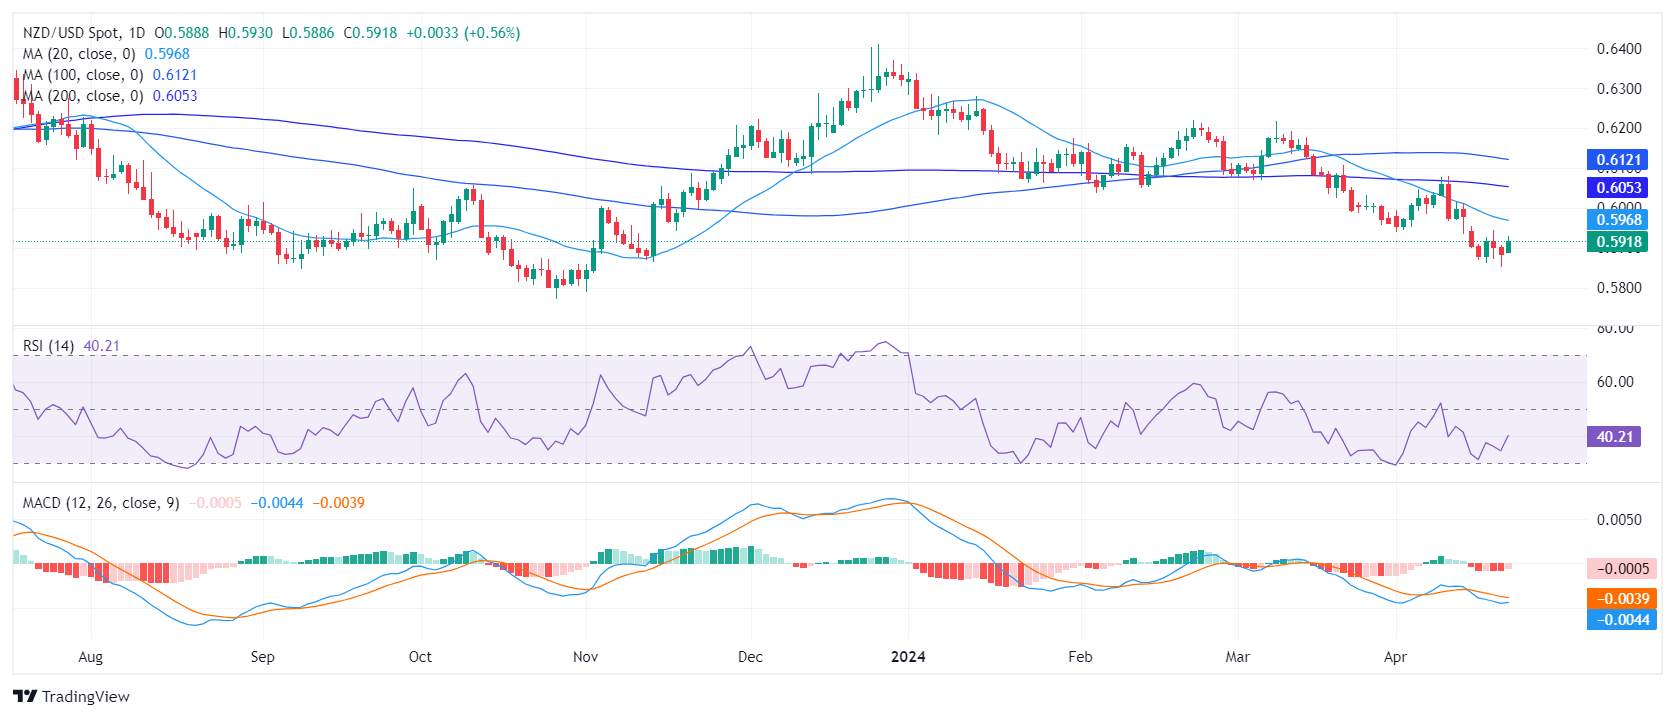
  • Diminishing red bars of the daily MACD imply a potential easing of bearish momentum, signaling an early indication of a bullish turnaround.
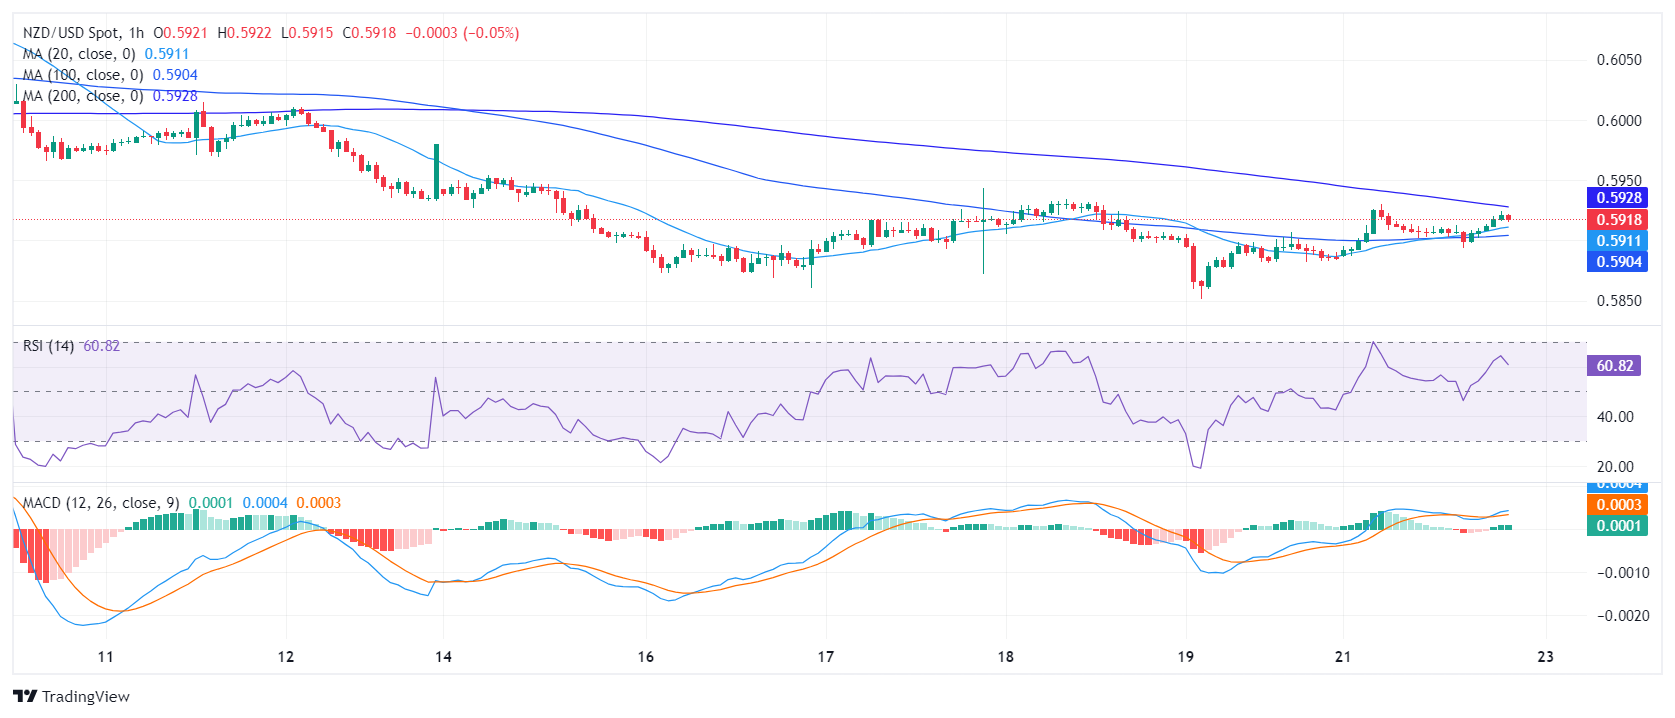
  • The hourly chart reveals an RSI oscillating in the positive zone, and MACD with green bars, signaling potential short-term positive momentum.

The NZD/USD pair advanced to 0.5920 on Monday, reflecting a gain of 0.47%. Overall, the bearish force remains strong, while the bulls begin to give signs of potential recovery, highlighting the start of a possible bullish reversal.

On the daily chart, the Relative Strength Index (RSI) remains in negative territory, indicating an ongoing bearish momentum. Although there is a minor upward trend, it remains short of breaking into the positive zone. The decreasing red bars of the Moving Average Convergence Divergence (MACD) suggest a slide in negative momentum, indicating possible signs of a potential bullish reversal.

NZD/USD daily chart
On the hourly chart, a similar condition prevails. The RSI has been oscillating in the positive territory for most of the session, but recently recorded a slight downward inclination, signaling a potential pullback. The MACD histogram also shows rising green bars, indicating a surge in positive momentum.

NZD/USD hourly chart
The broader market perspective reveals much regarding the NZD/USD's performance versus its Simple Moving Average (SMA). With the pair being below the 20,100 and 200-day SMA, a long and short-term downward pressure on the currency is evident.

In summary, there is a bearish dominance in the market, reinforced by both the RSI and MACD trends on the daily and hourly charts, as well as the SMA positioning. However, the slight increase in the daily RSI and the diminishing bearish momentum in the MACD could signify the early stages of a market reversal.


NZD/USD

Overview
Today last price 0.5919
Today Daily Change 0.0034
Today Daily Change % 0.58
Today daily open 0.5885
 
Trends
Daily SMA20 0.5973
Daily SMA50 0.6062
Daily SMA100 0.6123
Daily SMA200 0.6055
 
Levels
Previous Daily High 0.5907
Previous Daily Low 0.5851
Previous Weekly High 0.5954
Previous Weekly Low 0.5851
Previous Monthly High 0.6218
Previous Monthly Low 0.5956
Daily Fibonacci 38.2% 0.5873
Daily Fibonacci 61.8% 0.5886
Daily Pivot Point S1 0.5855
Daily Pivot Point S2 0.5825
Daily Pivot Point S3 0.5799
Daily Pivot Point R1 0.5911
Daily Pivot Point R2 0.5937
Daily Pivot Point R3 0.5967


Isenção de responsabilidade: Apenas para fins informativos. O desempenho passado não é indicativo de resultados futuros.
placeholder
O preço do ouro atinge um recorde de alta, com o aumento das tensões geopolíticas em focoO preço do ouro (XAU/USD) ganha impulso na segunda-feira. O metal amarelo atingiu um recorde de alta próximo a US$ 2.441 durante a sessão asiática de segunda-feira, em meio a esperanças renovadas de cortes nas taxas de juros do Federal Reserve (Fed) dos EUA e ao aumento das tensões geopolíticas no Oriente Médio.
Autor  FXStreet
5 Mês 20 Dia Seg
O preço do ouro (XAU/USD) ganha impulso na segunda-feira. O metal amarelo atingiu um recorde de alta próximo a US$ 2.441 durante a sessão asiática de segunda-feira, em meio a esperanças renovadas de cortes nas taxas de juros do Federal Reserve (Fed) dos EUA e ao aumento das tensões geopolíticas no Oriente Médio.
placeholder
Até onde o ouro pode subir este ano? Veja o que diz este especialistaInvesting.com – Com a divulgação dos mais recentes índices de inflação, os investidores do ouro permanecem atentos à direção futura dos preços do metal precioso.Embora a expectativa geral seja de que
Autor  Investing.com
6 Mês 14 Dia Sex
Investing.com – Com a divulgação dos mais recentes índices de inflação, os investidores do ouro permanecem atentos à direção futura dos preços do metal precioso.Embora a expectativa geral seja de que
placeholder
VALE3 Vale a Pena Comprar Ações da VALE? Análise Técnica GráficaNo vídeo "VALE3 Vale a Pena Comprar Ações da VALE? Análise Técnica Gráfica" teremos a oportunidade de ver uma análise técnica / análise gráfica das ações VALE3 e também do minério de ferro negociado na bolsa chinesa.
Autor  Roberto Fernandes
6 Mês 17 Dia Seg
No vídeo "VALE3 Vale a Pena Comprar Ações da VALE? Análise Técnica Gráfica" teremos a oportunidade de ver uma análise técnica / análise gráfica das ações VALE3 e também do minério de ferro negociado na bolsa chinesa.
placeholder
UBS enxerga recuperação das commodities mesmo com receios sobre demandaInvesting.com – Mesmo com receios e incertezas a respeito da demanda global, as commodities devem apresentar tendência de recuperação, disseram especialistas do banco UBS em relatório divulgado a clie
Autor  Investing.com
7 Mês 25 Dia Qui
Investing.com – Mesmo com receios e incertezas a respeito da demanda global, as commodities devem apresentar tendência de recuperação, disseram especialistas do banco UBS em relatório divulgado a clie
placeholder
UBS BB inicia cobertura de Banrisul com indicação neutraInvesting.com – Analistas do UBS BB iniciaram a cobertura das ações do Banrisul (BVMF:BRSR6) com recomendação neutra e preço-alvo de R$14. O tradicional banco regional estaria enfrentando novo desafio
Autor  Investing.com
7 Mês 31 Dia Qua
Investing.com – Analistas do UBS BB iniciaram a cobertura das ações do Banrisul (BVMF:BRSR6) com recomendação neutra e preço-alvo de R$14. O tradicional banco regional estaria enfrentando novo desafio
Produtos relacionados
goTop
quote