What is Trend Trading? Common Trend Trading Strategies & Indicators

Trend trading is a dynamic and widely-used strategy that empowers traders to harness market momentum and ride the wave of price movements over the medium to long term. Whether the market is surging upward or taking a downward turn, trend traders aim to capitalize on these shifts by identifying clear patterns and following the direction of the trend.
By leveraging powerful technical indicators, traders can anticipate whether an asset’s price is likely to rise or fall, making this strategy a favorite among both position and swing traders. In this article, we'll explore how trend trading works, why it's so popular, and how you can use it to your advantage across various markets.
1. Trend Trading: Uptrends & Downtrends
Trend Trading: Uptrends
An uptrend occurs when the value of the underlying asset increases, and the price moves up. Uptrends typically follow any pullback with a strong move to the upside, even though prices don't always move upwards without interruption.
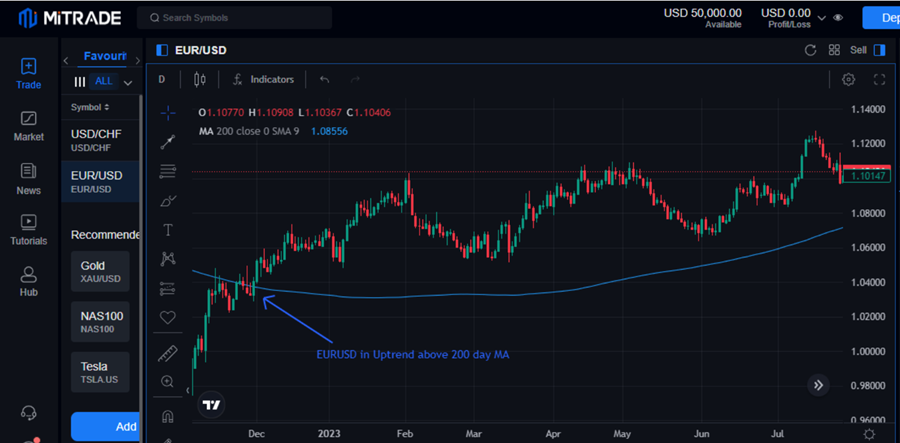
Image Source: Mitrade
Consequently, an uptrend is characterized by higher highs on the price charts with lower highs, where more buyers join the fray and push the price upwards. If the price starts making lower highs and lower lows, it marks the end of the uptrend.
During an uptrend, investors concentrate on purchasing to capitalize on the ongoing price increase.
Trend Trading: Downtrends
A downtrend is a chart pattern that occurs whenever an asset loses value; the price drops rather than increases. Consequently, in a chart pattern, a downtrend is characterized by lower highs and lower lows.
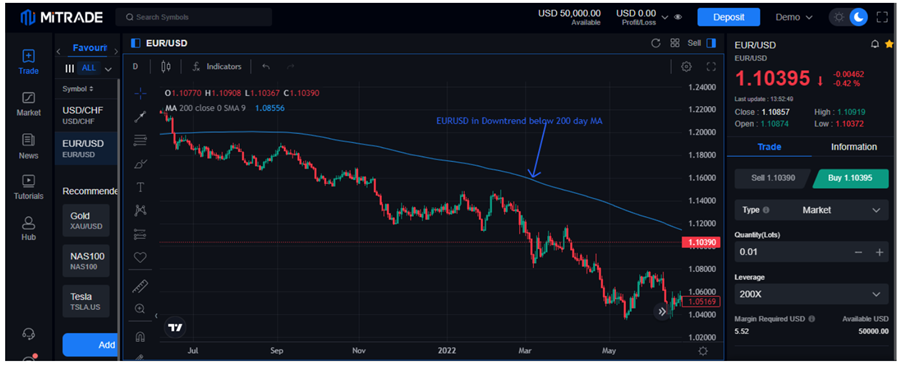
Image Source: Mitrade
A strong move to the downside usually follows any bounce back in price after a lower low as more sellers join the fray to push the price lower. Therefore, in downtrends, traders focus on opening short or sell positions to profit from further downside movements in price action.
2. Types of Trends
Secular Trends: These are long-term trends that last for years and even decades. They can be identified by focusing on yearly charts of assets under study. They are typically triggered by fundamental shifts in the economic structure or shifts in demographic patterns.
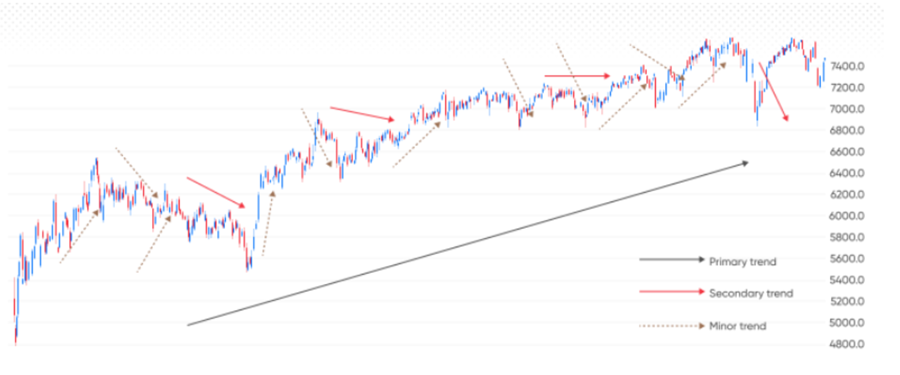
Image Source: capital
Primary Trends: They are primarily short-term trends that last months and a few years, caused mainly by changes in the business cycle, political environment, or monetary policy changes.
Secondary trends: These are trends that last a few weeks or months and are triggered by changes in investor sentiments or technical factors.
Intermediate trends: These are trends that last a few days or weeks and are caused by changes in supply and demand in a given asset and not the entire market.
Minor Trends: These are trends that last a few days or hours. They are trends that traders rely on for day trading to try and profit from short-term price movements.
3. Common Trend Trading Indicators
Moving Average
Moving average is one technical indicator in most trend trading strategies because it smooths out price data, creating an average price. It is taken over specific periods of 20 days, 50 days, or even 200 days, depending on preference.
The most popular is the 200-day simple moving average that is used to determine in which direction the price is trending. Consequently, whenever the 200-day SMA is angled to the upside and price above it, the asset is considered to be trending upwards. Consequently, traders look to enter long or buy positions as long as the price is above the 200-day SMA.
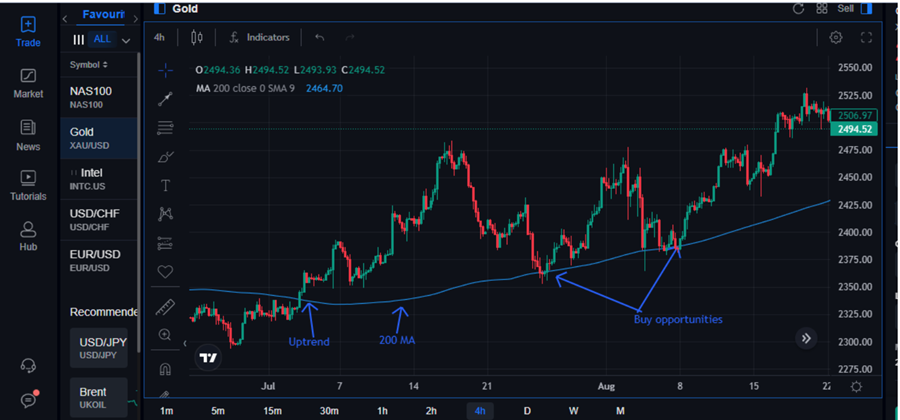
Image Source: Mitrade
The entry-level for a buy or long position would be when the price pulls back to the 200-day moving average, followed by a large candlestick signaling that buyers are in control and well poised to push the price upwards.
Similarly, the asset is considered a downtrend when the 200-day SMA is angled to the downside, and the price is below it. Consequently, traders can look to enter short or sell positions whenever the price bounces back close to the MA, resulting in the formation of a strong sell candlestick.
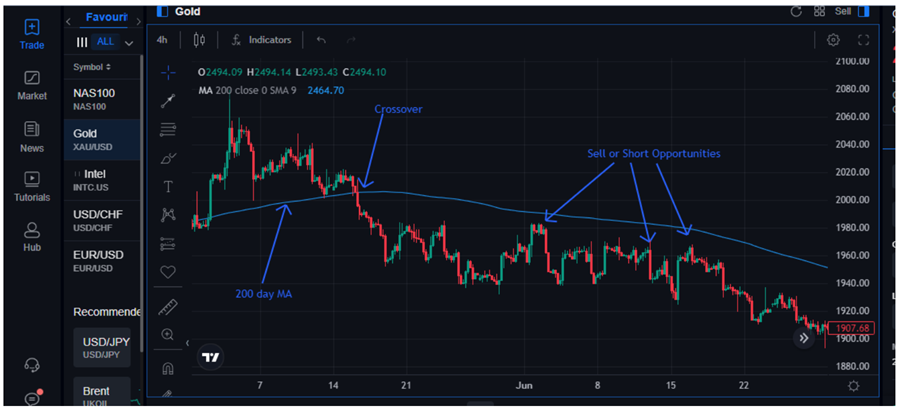
Image Source: Mitrade
On the other hand, whenever the moving average is flat or horizontal in a price chart, the market is considered to be in range and not trending in any given direction.
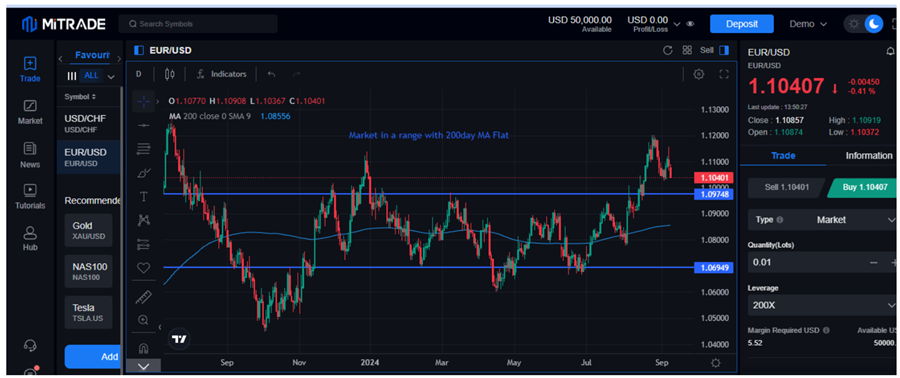
Image Source: Mitrade
The Moving average can also be used in crossover strategies. In this case, two moving averages are used: one that is fast-moving, such as 50, a moving average, and slow-moving, such as 200, a moving average.
A buy signal would occur when the 50-day moving average crosses the 200-day MA and starts trending upwards, signaling a buying opportunity. A sell signal would occur when the 50-day MA moves below the 200-day MA, signaling sellers are piling pressure and that the market is poised to trend lower.
Relative Strength Index
It is another popular trend trading indicator that provides valuable information on market momentum, containing readings of zero to 100. Buyers are in control whenever the RSI reading exceeds 50, and the market is trending upwards. Consequently, traders look to buy or take long positions.
Similarly, whenever the indicator reads below 50, it implies the market momentum is bearish, that sellers are in control, and that price will likely continue edging lower. Consequently, traders look to open short or sell positions.
Additionally, whenever the RSI indicator is above 70, the underlying asset is overbought, implying the asset has been bought too much. In most cases, traders look to open short or sell positions whenever the indicator reading is above 70, indicating a potential trend reversal.
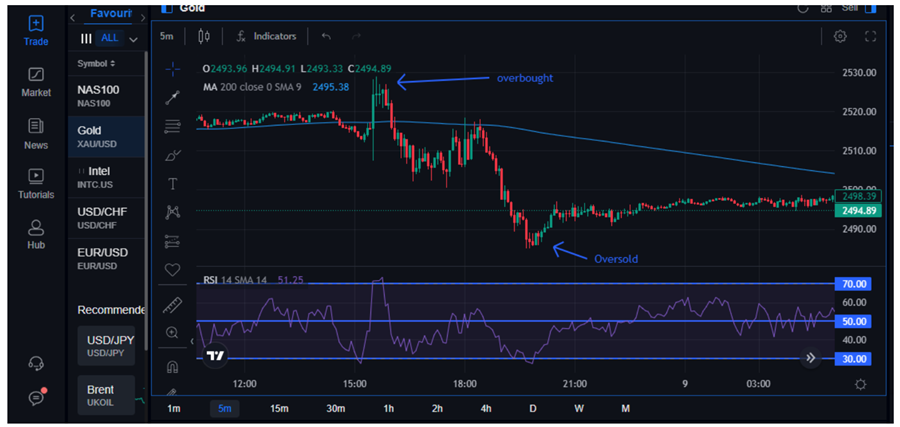
Image Source: Mitrade
Similarly, whenever the RSI is below 30, it implies the underlying asset is oversold and that a potential price reversal is likely to occur, resulting in the price bouncing back. In this case, trend traders can look to open buy or long positions when the RSI reading is below 30 and deep into oversold territories.
4. How to Practice Trend Trading: Best Strategies
#Step 1
The first step to engaging in trend trading entails identifying the underlying trend. It is important to know beforehand whether the asset trends upwards or downwards.
The moving average indicator can come in handy in identifying the trend. For example, if the price exceeds the 200-day MA, it indicates that the asset is trending upward and that its price is likely to continue increasing.
Similarly, a downward-angled indicator and a price below the 200-day MA indicate that the asset is in a downtrend and likely to continue declining. Therefore, one can look to open short or sell positions to profit from the downtrend.
#Step 2
Once the trend is identified, the next step in trend trading entails identifying the ideal level to open a Buy or Sell position.
Consequently, when using the 200-day MA, traders can look to open a buy or long position whenever the price is above the indicator but pulls back and only touches the indicator and does not close below. A large bullish candlestick forming near the indicator would serve as a solid buy signal.
Likewise, short sellers can look to open short or sell positions whenever the price has moved down significantly but bounces back, close to the 200 MA but does not close above. The formation of a large bearish candlestick near the MA suggests that it is time to open a short position.
The Best Strategies for Trend Trading
#Strategy 1: Long-Term Trend Trading Strategies
Traders who focus on long-term trends usually focus on broader time frames like the monthly, weekly, and daily charts. Traders concentrate on the stock market when applying trend-based strategies in these broader time frames. This is because a publicly listed company that performs well tends to draw in more investors to purchase its shares, which in turn offers the opportunity to follow a long-term trend based on the chart.
The concept is to identify a broad economic theme that could propel a lasting, sustainable trend within a specific market and then establish positions to profit from this shift.
Consequently, the asset is considered bullish if the stock price is above the 200-day moving average on the daily or weekly chart. A trader would look to open a buy position on any weakness in the market.
#strategy 2: Day Trading Strategy
Day trading strategies are favored by day traders aiming to profit from short-time price movements. In this approach, traders seek out markets that are expected to move in a given direction through a trading day.
A commonly used tool to spot the direction in which the market is likely to move in a day is the moving average. A trader would open as many positions as possible throughout the trading day to take advantage of any direction the price is moving. Likewise, trades are left open and closed after a few minutes or hours.
5. Risk management in trend trading
Successful trend trading depends on how well one manages risk. By tracking trends and placing suitable stop-loss orders, traders can lessen the risk of significant losses. Trend trading approaches frequently feature set exit strategies, which lessen the emotional toll of making decisions and aid in controlling risk more efficiently.
Some of the common risks that trend traders should be aware of include:
Reversal Risk
Trend trading is based on the belief that the current direction of price movement will persist. Nonetheless, there's always a chance that the trend will reverse and prices start moving in the opposite direction, leading to losses for traders who don't respond adequately.
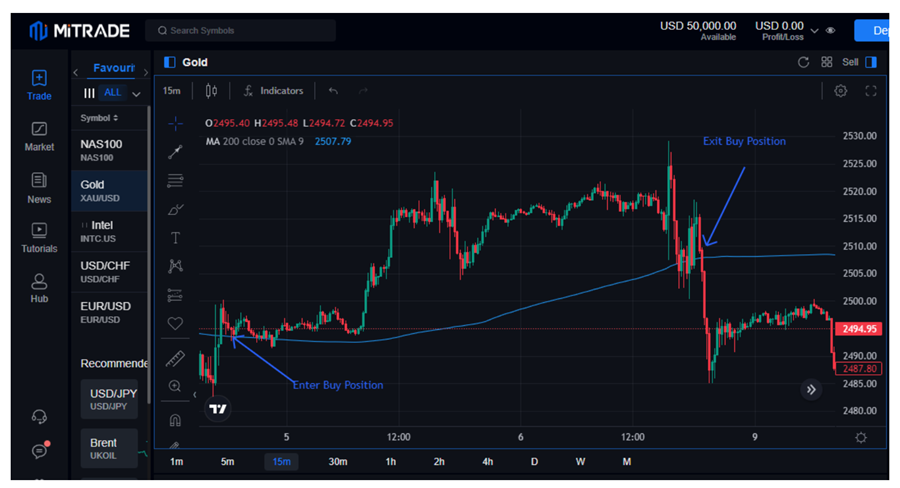
Image Source: Mitrade
Therefore, it is important to identify in advance when the price has changed direction. For instance, if the price were trending up and above the 200-day MA, a reversal would be in play if the price changed direction and moved below the 200-day MA. This would be the best time to close the buy position.
Overbought/ Oversold Risk
Trend traders always encounter the overbought or oversold risk. The oversold risk occurs when an asset is sold for a prolonged period and loses value significantly. The risk of price bouncing and moving up is usually high when oversold conditions kick in.
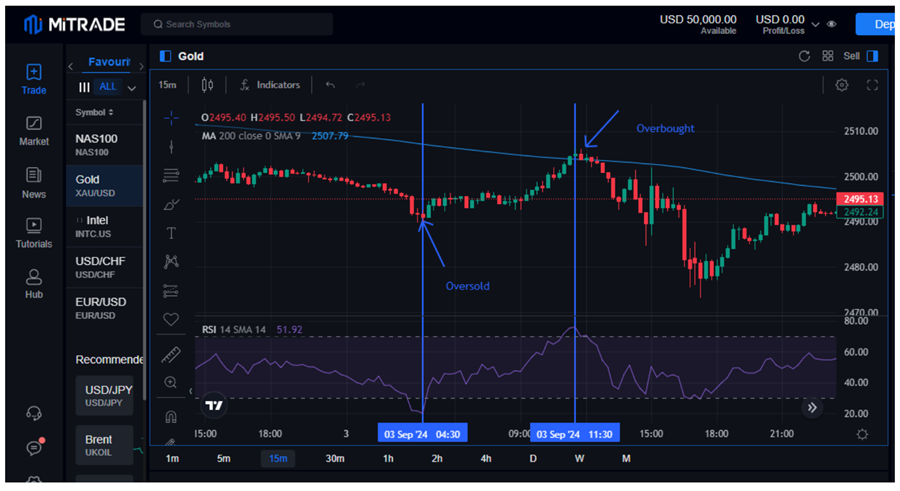
Image Source: Mitrade
Whenever an RSI reading is below 30, the asset is oversold. Therefore, trend traders should be wary of potential bounce back. Let's close the short position once the indicator drops below 30 and, after some time, starts bouncing back. Once it rises above 30, the asset price bounces off oversold conditions.
Similarly, overbought conditions occur when an asset is bought for a while, rising RSI above 70. When the RSI reverses direction and starts moving lower and drops below 70, it implies trend reversal and time to close the long or buy position
6. Summary
Trend trading is a strategy that relies on technical indicators to determine the direction of market movement. It is typically seen as a strategy for mid to long-term trading, though it could be applied to any time frame, depending on the duration of the trend.
Trend trading identifies trends early on and exits the market before they change direction. The most frequently used trend trading approaches utilize technical signals such as moving averages, the relative strength index (RSI), and the average directional index (ADX).
While it is one of the most effective trading strategies, without adequate preparation and risk control, one can lose a lot while leveraging the trend trading strategy.
7. FAQs
# What is a trend?
It is simply the direction in which the price is moving: Whenever the price is moving up or appreciating, the underlying asset is trending upwards. Likewise, if the asset is losing value, it is considered to be trending downward.
# How do you identify a trend?
The best way to identify a trend is through technical indicators. Consequently, if the price is above the 200-day MA, it is considered to be in an uptrend and a downtrend if it is below the MA.
# What is the best timeframe for trend trading?
The best time frame for trend trading depends on the type of trader. Long-term traders usually focus on the weekly, monthly, and yearly charts, where analysis is carried out. On the other hand, short-term traders pay close watch to daily, hourly, and minute price movements.
# Is trend trading a good strategy?
Yes, it can lead to significant returns when executed properly. Anyone who can identify a trend, open a position in the direction of the trend, and let it remain running for the duration of the trend is sure to make lots of money.
Before making any trading decisions, it is important to equip yourself with sufficient fundamental knowledge, have a comprehensive understanding of market trends, be aware of risks and hidden costs, carefully consider investment targets, level of experience, risk appetite, and seek professional advice if necessary.
Furthermore, the content of this article is solely the author's personal opinion and does not necessarily constitute investment advice. The content of this article is for reference purposes only, and readers should not use this article as a basis for any investment decisions.
Investors should not rely on this information as a substitute for independent judgment or make decisions solely based on this information. It does not constitute any trading activity and does not guarantee any profits in trading.
If you have any inquiries regarding the data, information, or content related to Mitrade in this article, please contact us via email: insights@mitrade.com. The Mitrade team will carefully review the content to continue improving the quality of the article.


