

Emotions significantly contribute to financial market volatility. However, measuring investor sentiment has traditionally been challenging. With advancements in technology, some financial institutions have developed tools to quantify this sentiment, such as the Fear and Greed Index, which tracks investor emotions to provide insights into market behavior.
Understanding the Fear and Greed Index can be invaluable for investors. It not only offers a clear snapshot of market sentiment but also highlights potential opportunities and risks. When fear dominates, it may indicate that stocks are undervalued, creating buying opportunities. Conversely, when greed prevails, it could signal overvaluation and the risk of a market correction.
This article explains the Fear and Greed Index and how to use it to make better investment decisions.
1. What is the Fear and Greed Index?
The Fear and Greed Index is a financial tool designed to measure the prevailing sentiment in the stock market by capturing the emotions of investors—specifically, whether they are driven by fear or greed. Developed by CNNMoney, the index provides a quick snapshot of market sentiment, helping investors understand the psychological forces influencing stock prices.

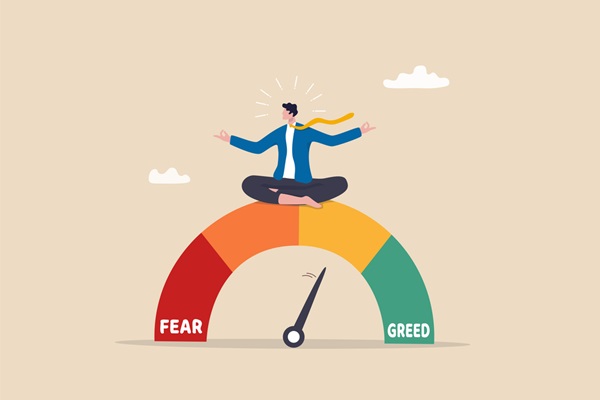
Fear & Greed Index in Stock market (Source: CNN)
Because of the success and relevance of the Fear and Greed Index in the stock market, a similar index has been developed for the crypto market, with a primary focus on Bitcoin. The differences between the index in these two markets will be discussed in Section 6 of this article. This article will predominantly analyze the Fear and Greed Index in the stock market.

Fear and Greed Index in the Crypto market (Source: Coinstats)
By capturing the extremes of investor sentiment, the Fear and Greed Index provides insights into potential market turning points. When fear dominates, investors may become overly pessimistic, driving asset prices lower, while excessive greed can lead to overvaluation and market bubbles.
Thus, the index acts as a contrarian indicator, offering investors the ability to gauge whether the market is nearing a point of reversal. Although not a standalone predictor of market movements, the Fear and Greed Index is an important tool for understanding the emotional forces at play, guiding more informed investment decisions.
2. What Does the Fear and Greed Index Measure?
The Fear and Greed Index measures the emotional sentiment of investors, offering a snapshot of whether the market is dominated by fear, which can lead to risk aversion, or by greed, which drives risk-taking. This index captures the psychological drivers that influence market trends and investor behavior. The key aspects it measures include:
Market sentiment: The overall mood of investors, whether they are feeling optimistic (greedy) or pessimistic (fearful). For example, during times of extreme greed, investors might pour money into stocks, pushing prices higher, while extreme fear could result in widespread selling and lower prices.
Risk appetite: The degree to which investors are inclined to take on risk. A high level of greed suggests a strong appetite for risk, with investors chasing higher returns even in risky assets. Conversely, high fear reflects a preference for safety, leading to increased demand for less risky assets like bonds.
Market momentum: The strength and direction of market movements, often driven by collective emotions. In a greedy market, momentum is typically strong and bullish, with rapid price increases. In a fearful market, momentum can shift to the downside, with sharp declines as investors rush to minimize losses.
Investor behavior: The actions taken by investors based on their emotions. For instance, during periods of greed, there may be a surge in speculative buying, while during periods of fear, investors might seek to preserve capital, leading to a flight to safety in more stable assets.
Market extremes: Detects potential turning points by highlighting when investor emotions have reached extreme levels. For instance, when extreme greed prevails, it may signal an overbought market that is due for a correction. Conversely, extreme fear can indicate an oversold market with the potential for a rebound.
These measurements help investors understand the emotional context of the market, providing valuable insights into potential risks and opportunities based on the prevailing sentiment.
3. How is the Fear and Greed Index Calculated?
The Fear and Greed Index provides investors with insights into market psychology, helping them make informed decisions based on prevailing emotions in the market. It is calculated using a combination of several indicators that measure market sentiment. Here’s a breakdown of how it works:
Key Components:
Market Momentum: This measures the S&P 500's performance over a specific period, comparing it to its average performance.
Stock Price Strength: This looks at the number of stocks hitting new highs versus those hitting new lows.
Stock Price Breadth: This assesses the volume of stocks advancing versus declining.
Put and Call Options: This compares the demand for put options (bearish) versus call options (bullish).
Junk Bond Demand: This measures the spread between yields on junk bonds and safer bonds. A smaller spread indicates greed.
Market Volatility: This uses the VIX (Volatility Index), which reflects market expectations of future volatility. Higher volatility indicates fear.
Safe Haven Demand: This examines the demand for safe-haven assets like gold compared to stocks.
Each component is scored on a scale from 0 to 100, where:
0-49 indicates fear
50 is neutral
51-100 indicates greed
The index is then generated by taking the average of these scores, reflecting overall market sentiment.
4. How to Use the Fear and Greed Index in Trading?
Using the Fear and Greed Index in trading can provide valuable insights into market sentiment, helping traders make more informed decisions. Here’s how you can effectively incorporate the index into your trading strategy:
Identify market extremes
Extreme Fear (0-25): When the index shows extreme fear, it often indicates that investors are overly pessimistic, which can lead to undervaluation of stocks. This may present a buying opportunity, as prices might rebound once fear subsides. Traders can look for fundamentally strong stocks that are being sold off due to market panic and consider buying them at lower prices.
Extreme Greed (75-100): Conversely, when the index indicates extreme greed, it suggests that investors are overly optimistic, potentially leading to overvaluation. This can be a signal to take profits or avoid buying new positions, as the market may be due for a correction.
Timing entries and exits
The Fear and Greed Index can help traders time their market entries and exits. For example:
Entry: If you’re looking to buy into the market, doing so during a period of extreme fear could result in better entry prices.
Exit: If you’re holding positions and the index is showing extreme greed, it might be a good time to consider taking profits before a potential market pullback.
Complementing Technical Analysis
Traders should combine the Fear and Greed Index with other technical analysis tools to anticipate the price trends. For example:
Support and Resistance Levels: If the index indicates extreme fear, check if prices are approaching key support levels, which could strengthen the case for a buying opportunity.
Moving Averages: If the index is showing greed, and prices are far above key moving averages, it might reinforce the idea that the market is overbought.
Risk Management
The index can also inform your risk management strategy:
Position Sizing: During periods of extreme greed, you might reduce position sizes to mitigate risk in case of a market correction.
Stop-Loss Adjustments: In times of extreme fear, consider tightening stop-loss levels to protect against further declines, while still being open to potential market recovery.
The Fear and Greed Index is a valuable tool for gauging market sentiment and refining trading strategies. By leveraging it to spot market extremes, optimize entry and exit points, and manage risk, traders can strengthen their approaches and more effectively navigate market volatility. However, it's crucial to use the index alongside other analytical tools and not rely on it exclusively for trading decisions.
5. Limitations of the Fear and Greed Index
The Fear and Greed Index is a useful tool for gauging market sentiment, but it has several limitations that traders and investors should be aware of when incorporating it into their decision-making process. Here are some key limitations:
Over-simplification: The index reduces complex market dynamics to a single score, which might oversimplify the nuances of investor behavior. Markets are influenced by a wide range of factors—economic data, geopolitical events, corporate earnings—that aren't fully captured by the index.
Short-term focus: The Fear and Greed Index is based on short-term indicators, making it more reflective of immediate market sentiment rather than long-term trends. This can lead to potential overreaction to temporary market movements, which might not indicate a lasting trend.
Lagging indicator: The index tends to reflect what has already happened in the market rather than predicting future movements. By the time extreme fear or greed is indicated, the market may have already begun to correct itself, reducing the index's effectiveness as a forward-looking tool.
Market context ignored: The index does not account for broader market or economic conditions, such as interest rates, inflation, or macroeconomic trends, which can significantly influence market behavior. It focuses solely on sentiment-driven indicators, which may not provide a complete picture.
Potential for misinterpretation: In some cases, extreme fear may be justified by deteriorating economic conditions, and buying in such a scenario could lead to further losses.
Limited scope: The index should not be used in isolation. It is important to combine it with other forms of analysis—technical, fundamental, and macroeconomic—to form a more comprehensive view of the market.
Potential for herd behavior: If too many investors rely on the index, it could contribute to herd behavior, where investors collectively make the same decisions based on the index, potentially exacerbating market volatility rather than mitigating it.
Traders and investors should use it in conjunction with other analytical tools and approaches, keeping in mind its focus on short-term sentiment and the potential risks of oversimplification and misinterpretation.
6. What Are the Differences Between the Fear and Greed Index in Stocks and Cryptos?
The Fear and Greed Index is used in both stock markets and cryptocurrency markets to gauge investor sentiment, but there are significant differences in how the index is calculated and interpreted in these two contexts. Here are the key differences:
Aspect | Stock Market | Cryptocurrency Market |
Market Characteristics | Mature, regulated, influenced by macroeconomic factors and corporate earnings. | Relatively new, highly volatile, largely unregulated, driven by speculation and news |
Indicators | - Stock Price Momentum: S&P 500 vs. 125-day moving average. - Stock Price Strength: 52-week highs vs. lows. - Stock Price Breadth: Advancing vs. declining volume. - Put and Call Options: Put-to-call ratio. - Market Volatility (VIX): CBOE Volatility Index. - Junk Bond Demand: Yield spreads between junk bonds and investment-grade bonds. - Safe-Haven Demand: Returns of stocks vs. safe assets (e.g., Treasury bonds). | - Volatility: Current volatility and max drawdowns of major cryptocurrencies (e.g., Bitcoin). - Market Momentum/Volume: Trading volume and price momentum of cryptocurrencies. - Social Media: Analysis of social media mentions and sentiment. - Surveys: Public sentiment polls and surveys. - Dominance: Bitcoin dominance over other cryptocurrencies. - Trends: Google Trends data related to cryptocurrency searches. |
Interpretation and usage | - Extreme Fear (0-25): May indicate undervaluation and buying opportunities. - Extreme Greed (75-100): May signal overvaluation and potential market corrections. | - Extreme Fear: Often reflects panic selling and potential buying opportunities in a highly volatile environment. - Extreme Greed: Indicates speculative bubbles and potential risks of sharp sell-offs. |
The Fear and Greed Index operates on similar principles in both stock and cryptocurrency markets, providing a gauge of investor sentiment. However, the stock market’s more stable, regulated environment contrasts sharply with the volatile, speculative nature of the cryptocurrency market. The indicators used and their interpretations differ to reflect these unique market characteristics. In both cases, the index should be used alongside other analytical tools and market insights to make well-rounded investment decisions.
7. Summary
The Fear and Greed Index is a powerful tool for assessing market sentiment, offering insights into whether investors are driven by fear or greed. In the stock market, it can signal buying opportunities during extreme fear and caution against potential overvaluation during times of greed. In the cryptocurrency market, it captures the volatile and speculative nature of digital assets, highlighting sentiment shifts quickly.
Despite its usefulness, the index should be used in conjunction with other analysis methods due to its focus on short-term sentiment and inherent limitations. Understanding both its strengths and limitations allows investors to better navigate market trends and make more informed decisions.
8. FAQs
#How frequently is the Fear and Greed Index updated?
The frequency of updates depends on the market. For stocks, the index is typically updated daily. For cryptocurrencies, it may be updated more frequently due to the market's higher volatility, often reflecting changes on an hourly or daily basis.
#Where can I find the Fear and Greed Index?
The Fear and Greed Index is available through financial news websites and platforms. For stocks, CNNMoney provides the index, while various cryptocurrency-focused platforms and websites offer crypto-specific indices.
#Can the Fear and Greed Index predict market movements?
While the index provides insights into current sentiment and potential market trends, it is not a predictive tool. It reflects existing market conditions rather than forecasting future movements, so it should be used with other analysis methods for better accuracy.
#What should investors do if the Fear and Greed Index shows conflicting signals?
Conflicting signals may indicate market uncertainty or a transitional phase. In such cases, investors should look at additional indicators, perform more in-depth analysis, and consider broader market conditions to make informed decisions.
#Is the Fear and Greed Index applicable to all asset classes?
The index currently targets stocks and cryptocurrencies, but its principles can be applied to commodities and forex. However, the specific indicators and interpretations may vary based on the asset class.
Before making any trading decisions, it is important to equip yourself with sufficient fundamental knowledge, have a comprehensive understanding of market trends, be aware of risks and hidden costs, carefully consider investment targets, level of experience, risk appetite, and seek professional advice if necessary.
Furthermore, the content of this article is solely the author's personal opinion and does not necessarily constitute investment advice. The content of this article is for reference purposes only, and readers should not use this article as a basis for any investment decisions.
Investors should not rely on this information as a substitute for independent judgment or make decisions solely based on this information. It does not constitute any trading activity and does not guarantee any profits in trading.
If you have any inquiries regarding the data, information, or content related to Mitrade in this article, please contact us via email: insights@mitrade.com. The Mitrade team will carefully review the content to continue improving the quality of the article.


