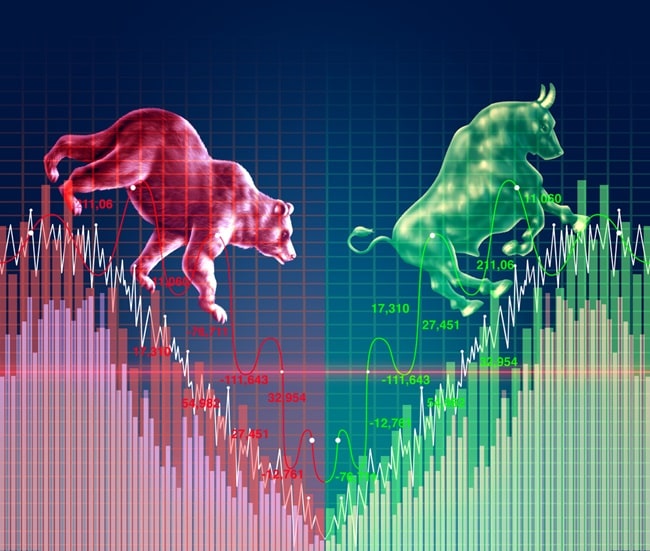
In the financial world, the terms "Bullish" and "Bearish" are familiar concepts that reflect the sentiment and predictions of market participants. Bullish and Bearish are not just technical terms, but also indicate the opportunities and risks in shaping an investment strategy.
Understanding these two concepts not only helps investors feel more confident in their decision-making process but also serves as a key to exploiting opportunities and facing the challenges of the financial market. For this reason, let's delve deeper into the terms Bullish and Bearish in the following article to understand exactly what they mean, and what investors should do during such market conditions to best capture the opportunities.
1. What is Bullish and Bearish?
"Bullish" and "Bearish" are two terms commonly used in the financial markets to describe the market sentiment and the predicted price trend of a particular asset such as stocks, cryptocurrencies, or commodities. Specifically:
Bullish: When an investor is "Bullish", it means they believe the price of an asset will increase in the future. This person has a positive outlook on the market and expects a strong price surge. They may buy the asset with the hope of selling it later at a higher price to generate profits.
Bearish: When an investor is "Bearish", they believe the price of an asset will decrease in the future. This person has a negative outlook on the market and expects a significant price decline. They may sell the asset or execute other transactions to profit from the anticipated price drop.
Additionally, a prolonged Bullish state is referred to as a Bull Market, while a prolonged Bearish state is called a Bear Market.
Example of Bullish Sentiment:
At the end of 2017, Bitcoin experienced an unprecedented surge, increasing from around $1,000 at the beginning of the year to nearly $20,000 in December 2017. This was driven by growing interest in and adoption of cryptocurrencies, particularly by institutional investors. The upward price trend continued in early 2018, with the total market capitalization of all cryptocurrencies reaching an all-time high. Investors at that time had a Bullish outlook on the market, which led to a significant influx of capital into the cryptocurrency space, fueling the boom.
Example of Bearish Sentiment:
A classic example is the price decline of Ethereum from January 2018 to December 2018. During this period, Ethereum's price went through a significant correction, dropping from its all-time high of around $1,400 in January 2018 to around $85 in December 2018. This downward price trend was driven by several factors, including a general market downturn, concerns about scalability and network congestion, as well as increased competition from other blockchain projects. Investors at the time had a Bearish perspective and actively sold their Ethereum holdings to exit the market or anticipated buying back at lower prices.
2. The Difference Between Bullish and Bearish
Bullish and Bearish are two adjectives used to describe two different states of the market or an investor's belief in future market performance. They are opposites in nature and also have different identifying signs. The table below will discuss a few identifying signs and compare them to highlight the differences during the Bullish and Bearish periods.
Characteristics | Bullish | Bearish |
Market Trend | Upward | Downward |
Investor Sentiment | Optimistic | Pessimistic |
Price Movement | Increasing | Decreasing |
Volume | Increasing | Decreasing |
Chart Patterns | Bullish patterns (e.g., Bullish Engulfing;Three White Soldiers;Morning Star) | Bearish patterns (e.g., Bearish Engulfing;Evening Star;Three Black Crows ) |
3. Bullish and Bearish Signs in Technical Analysis
In this section, we will explore how to identify Bullish and Bearish signs in technical analysis, specifically the familiar candlestick patterns, to detect potential market reversals.
Bullish Candlestick Patterns
Bullish Engulfing
The Bullish Engulfing pattern is a reversal pattern that signals the end of a downtrend. It is characterized by a large green/white candlestick that "engulfs" the previous candlestick.
The bullish engulfing candlestick is a notable signal if it occurs at key market levels such as support zones, demand zones, or trend lines.
For the bullish engulfing pattern to be valid, the trading volume at that time must be high, and the body of the engulfing candlestick must completely cover the body of the previous candlestick. The price must drop below the previous day's low, but the buying pressure has pushed it above the previous day's high.
If traders spot this candlestick pattern, they may consider taking a long position as the bulls are now in control of the market, and the downtrend has likely ended.
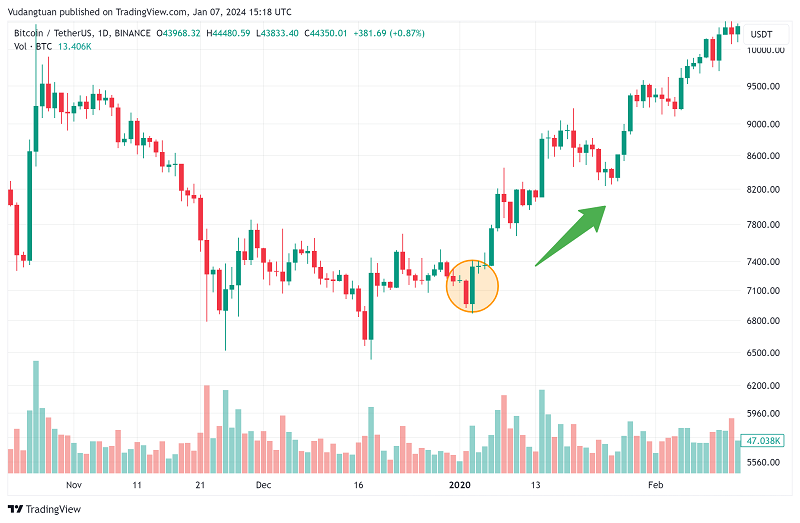
Example of Bullish Engulfing Pattern (Source: Tradingview)
Hammer and Inverted Hammer
Hammer and Inverted Hammer are unique candlestick patterns that appear to be opposites but actually indicate a potential price reversal to the upside.
The Hammer pattern consists of a "hammer" with a long lower wick and a small upper body, which suggests that the sellers tried to push the price down, but were met with strong buying pressure, causing the price to bounce back up and create the long lower wick. The signal will be more reliable if the price closes higher than the open.
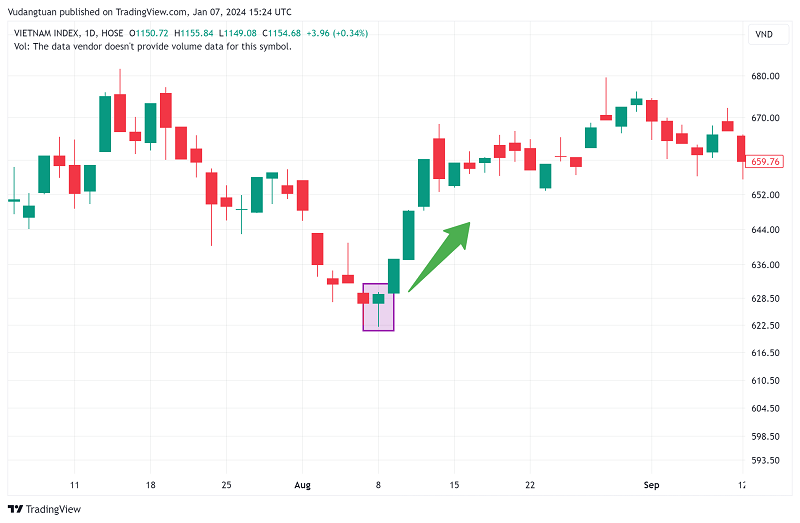
Example of Hammer Pattern (Source: Tradingview)
Meanwhile, the Inverted Hammer will have a long upper wick and a small lower body. This pattern demonstrates strong selling pressure, however it is not enough to push the price down further, and therefore signals a potential price reversal to the upside in the near future.
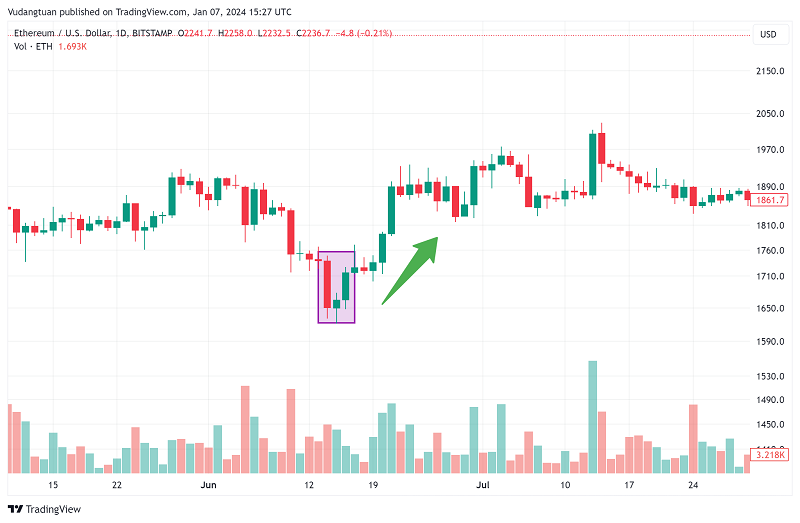
Example of the Inverted Hammer pattern (Source: Tradingview)
Morning Star
The Morning Star is a 3-candlestick pattern that can be used to predict a bullish reversal with high accuracy.
The first candle is typically a large or medium-sized bearish candle, indicating that the sellers are in full control of the market. The second candle is a small-bodied candle, preferably with a small body, suggesting that the selling pressure is starting to subside as buyers start to participate. Finally, the third candle is a bullish candle, preferably with a large body that completely engulfs the small body of the previous candle, confirming that the sellers have lost control.

Example of Morning Star Pattern (Source: Tradingview)
Three White Soldiers
Three White Soldiers is simply three consecutive bullish candles, indicating that the buyers have entered the market with strong buying pressure. This is demonstrated by the fact that the opening price of each subsequent candle is higher than the previous one. This pattern can be traded in conjunction with other indicators such as trend lines and Fibonacci retracements.
When using this pattern, it's important to note that the size of the candles is crucial, along with the trading volume shown on the chart. While it signifies a bullish signal, traders should also be cautious with this candlestick pattern, as the three strong bullish candles may attract short-term profit-taking pressure before the uptrend can continue.
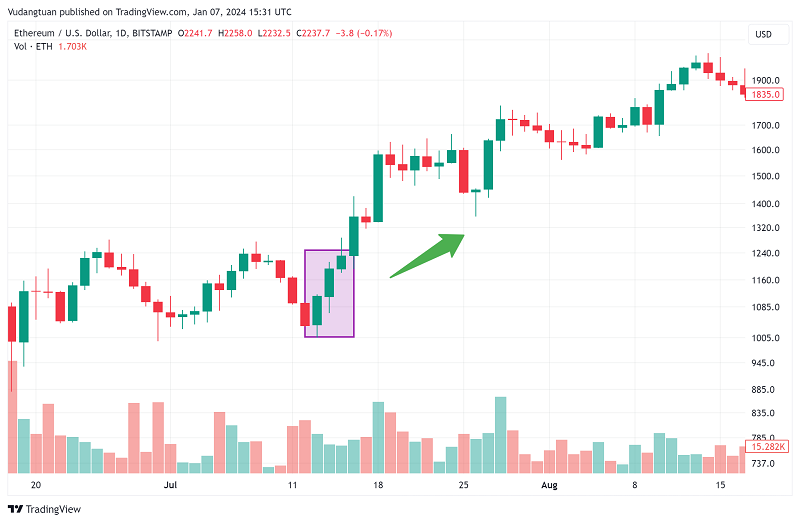
Example of Three White Soldiers Pattern (Source: Tradingview)
Bearish Candlestick Pattern
Bearish Engulfing
The Bearish Engulfing candlestick pattern often signals the reversal of an uptrend with strong selling pressure from the bears. This pattern is formed by two candlesticks, with the second, bearish candlestick engulfing the body of the previous green candlestick.
For the Bearish Engulfing pattern to be valid, the trading volume of the bearish candlestick must completely engulf the previous candlestick. The price had at one point risen higher than the previous day's closing price, but the selling pressure then pushed it down, breaching the previous day's low.
When this candlestick pattern is spotted, traders may consider taking a short position, as the bears have demonstrated absolute strength. Traders can further confirm the bearish signal by combining it with other indicators such as RSI, MACD, or trading volume. For example, if the RSI is in the overbought zone and the trading volume is high, this is likely a strong distribution candle, clearly signaling a trend reversal.
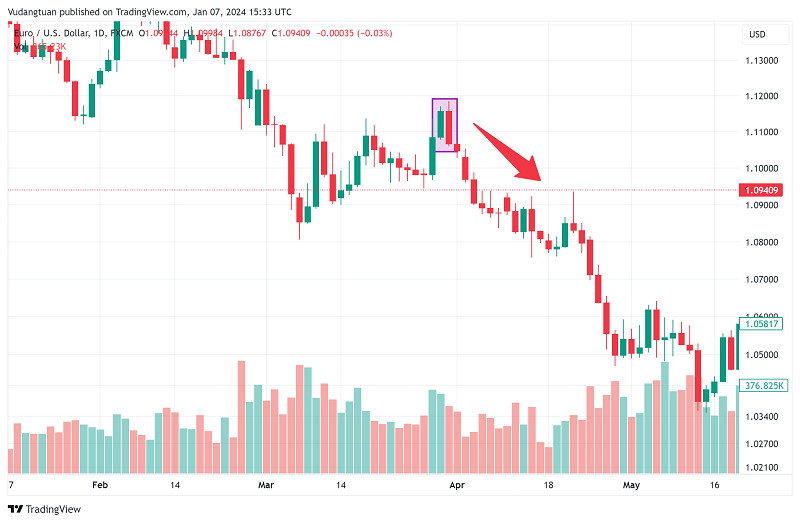
Example of a Bearish Engulfing candlestick pattern (Source: Tradingview)
Evening Star
The Evening Star is a candlestick pattern used by traders to analyze the potential for an uptrend to reverse into a downtrend. This candlestick pattern consists of three candles: a large green/bullish candle, a small-bodied candle with a long upper wick, and a red/bearish candle.
The long upper wick on the middle candle indicates that there was strong selling pressure, causing the bulls to lose their ground and push the price higher, forming the long upper wick. If the third candle is a strong bearish candle, it serves as confirmation that the market has officially reversed to a downtrend.
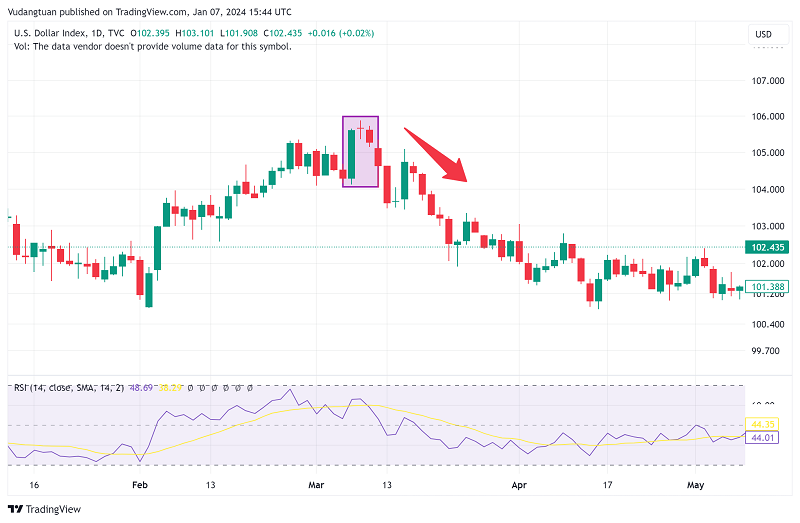
Example of the Evening Star pattern (Source: Tradingview)
The Three Black Crows
The Three Black Crows is a candlestick pattern used to predict the reversal of an uptrend into a downtrend. It consists of three consecutive strong bearish candles, indicating very strong selling pressure and an overall bearish market condition. Typically, after the three consecutive bearish candles, the market may have a technical bounce-back candle before resuming the downtrend. This bounce-back period is when traders may consider entering a short position.
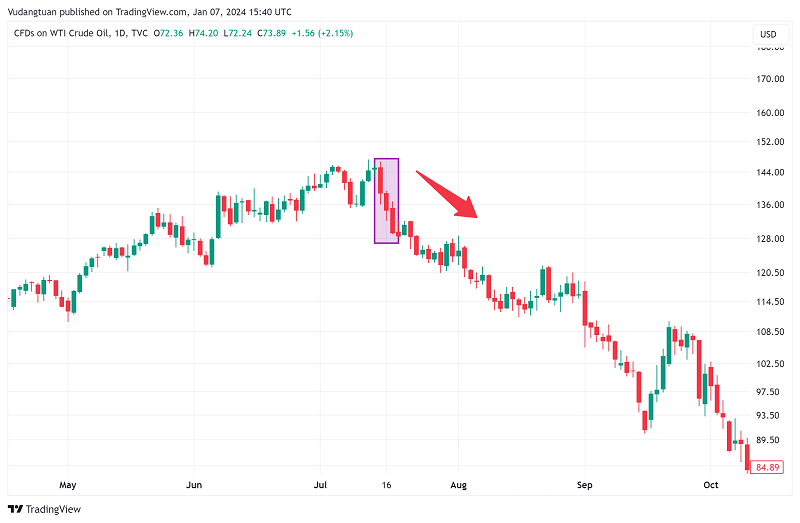
Example of the Three Black Crows candlestick pattern (Source: Tradingview)
Hanging Man
The Hanging Man is a bearish candlestick pattern that appears at the end of an uptrend. The key to identifying this pattern is strong selling pressure.During the formation of the candle, there is an intense battle between selling pressure and buying pressure. The candle closing with a long lower wick may lead many to believe that the sellers have run out of steam. However, the strong selling pressure at the top is a signal of a bearish market condition and the potential start of a downtrend.
Additionally, it's important to note that the Hanging Man pattern is confirmed if the price the following day sees a strong decline. If the closing price of the next candle is lower than the Hanging Man candle, this will be a clear signal of the start of a downtrend. Conversely, if the next candle still has bullish momentum with a closing price higher than the Hanging Man, then this candlestick pattern is not confirmed as bearish.
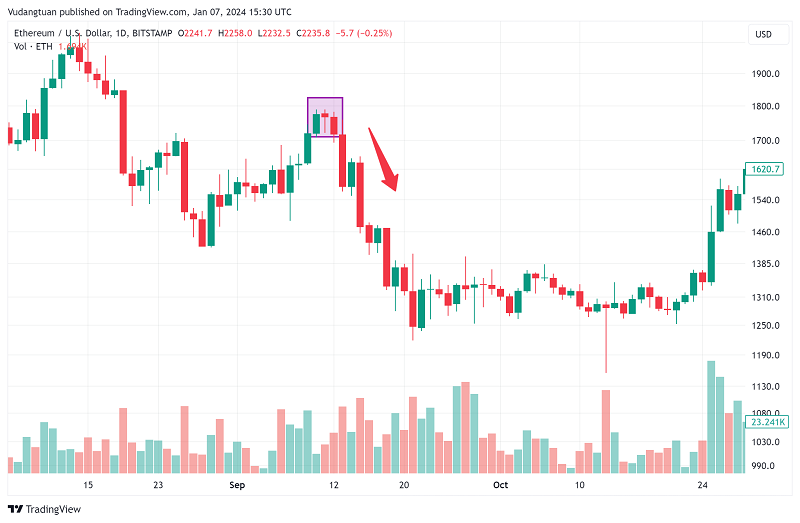
Example of the Hanging Man pattern (Source: Tradingview)
4. Things to note when assessing the Bullish and Bearish market psychology
Look for more confirming signals
There are many factors that can make the market psychology Bullish or Bearish. Investors should combine multiple signs to ensure that the Bullish or Bearish trend is reliable. For example, when prices rise sharply accompanied by high trading volume, and supported by positive news, those will be convincing signs to trade with a Bullish mindset. Conversely, if the market is filled with bad news and prices rise with low trading volume, investors need to be very careful as there is no synchronization of positive signals.
Find a reasonable entry point
If you determine that the market is in a Bullish or Bearish state, investors should look for a reasonable entry point that can capitalize on this opportunity. Based on the candlestick pattern, investors will be able to identify where to place buy or sell orders. Usually, an uptrend will always have a point where the price corrects to allow traders to enter long positions. Conversely, in a downtrend, there will always be a point where the price bounces back to enter short positions.
Thoroughly study technical analysis to be able to find the optimal buy or sell points. Don't forget to accompany them with specific stop-loss and take-profit orders.
Limit the FOMO (Fear of Missing Out) mentality
The financial market always contains many traps and can go in any direction that traders cannot foresee. Even when we identify Bullish signs, it can turn Bearish at any time just by the release of bad news.
Moreover, be careful with market "fake outs" when the price seems to be rising but is actually falling to trap investors. Even when the market is determined to have many Bullish signs, it still has a probability of being wrong, no matter how small. That's why investors need to be prepared for any unexpected developments after entering a position.
Set clear goals
Before entering a position, set clear goals for yourself. This prevents the trader from being swept away by the market or becoming overly confident in their own arguments, which could turn a profitable position into a loss when the market quickly reverses to an unfavorable direction.
5. Conclusion
In summary, Bullish and Bearish are two terms used to indicate the market sentiment and an investor's forecast of future developments. The Bullish state drives investors to buy due to expectations of price increases, while Bearish supports the selling of assets in order to buy back at lower prices.
Determining a Bullish or Bearish state can sometimes be very difficult as the market can change unexpectedly. Investors should have a clear understanding of the signs in both fundamental and technical analysis to prepare a trading plan for themselves in order to respond to any situation that may occur.
Before making any trading decisions, it is important to equip yourself with sufficient fundamental knowledge, have a comprehensive understanding of market trends, be aware of risks and hidden costs, carefully consider investment targets, level of experience, risk appetite, and seek professional advice if necessary.
Furthermore, the content of this article is solely the author's personal opinion and does not necessarily constitute investment advice. The content of this article is for reference purposes only, and readers should not use this article as a basis for any investment decisions.
Investors should not rely on this information as a substitute for independent judgment or make decisions solely based on this information. It does not constitute any trading activity and does not guarantee any profits in trading.
If you have any inquiries regarding the data, information, or content related to Mitrade in this article, please contact us via email: insights@mitrade.com. The Mitrade team will carefully review the content to continue improving the quality of the article.


