The VIX Index, often referred to as the "fear gauge" of the financial markets, is one of the most widely recognized indicators for measuring market sentiment, particularly in the stock market. During periods of significant declines in U.S. equities, the VIX tends to spike dramatically, reflecting heightened investor anxiety. This volatility presents opportunities for savvy investors who can profit from movements in the VIX itself.
But what exactly is the VIX Index? How can investors assess market risk and seize opportunities by monitoring this crucial indicator? This article aims to answer these questions and provide a deeper understanding of the VIX Index, its implications for market sentiment, and strategies for navigating market fluctuations using the principle of "be greedy when others are fearful."
1. What is the Volatility Index (VIX)?
The VIX Index, short for Volatility Index, is commonly referred to as the "fear index." It enables investors to profit from expected fluctuations in the S&P 500 index. The term "fear index" stems from investor psychology, as market fears often trigger rapid price movements during periods of panic.
The higher the level of anxiety, the more the VIX rises, indicating that investors anticipate significant declines in risky assets. Established and maintained daily by the Chicago Board Options Exchange (CBOE) since 1993, the VIX measures expectations of volatility in the S&P 500 over the next 30 trading days.

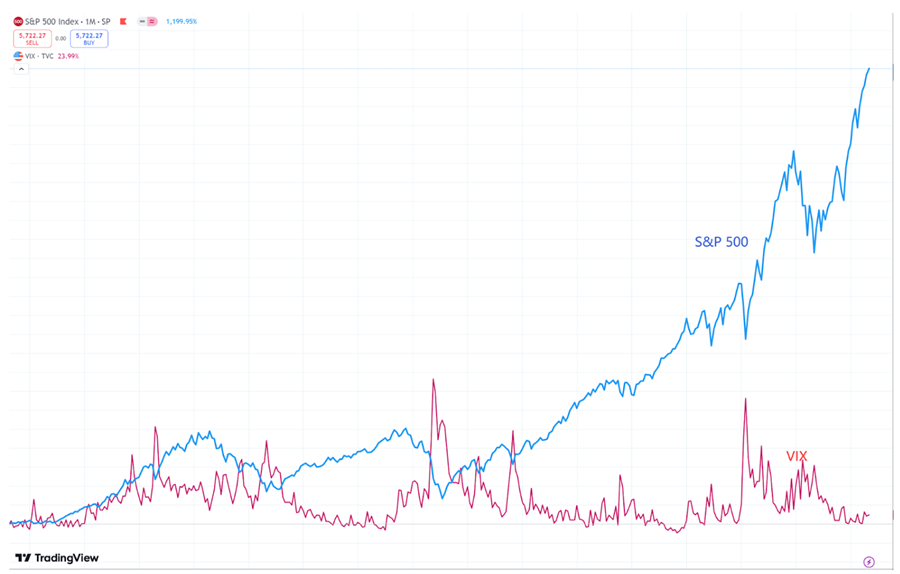
Source: Tradingview
As the VIX index reflects market sentiment, it often moves inversely to the S&P 500; when investor anxiety increases, VIX prices tend to rise while S&P 500 values generally fall.
2. How to calculate the Volatility Index (VIX)?
Calculating the VIX involves a complex formula based on the prices of S&P 500 options. The core of the VIX calculation is derived from the volatility of these options prices, using a weighted average of a range of qualifying call and put option prices.
First, different expiration dates and strike prices of S&P 500 call and put options are collected. Next, the implied volatility for each option is calculated based on these prices. Then, a weighted average method integrates the data from various options to arrive at the final VIX value.
The formula for calculating the VIX is:

Where:
Ci= price of the call option
Pi = price of the put option
Ki= strike price of the options
T = time to expiration in days (typically set to 30)
The summation is over all relevant strike prices.
The VIX expresses the expected volatility over the next 30 days as an annualized percentage. For example, a VIX value of 15 indicates an expected annual volatility of 15%, suggesting that over the next 30 days, the standard deviation of volatility is approximately 4.33%. This means there is a 68% probability that the S&P 500 will move within a range of ±4.33% during that period.
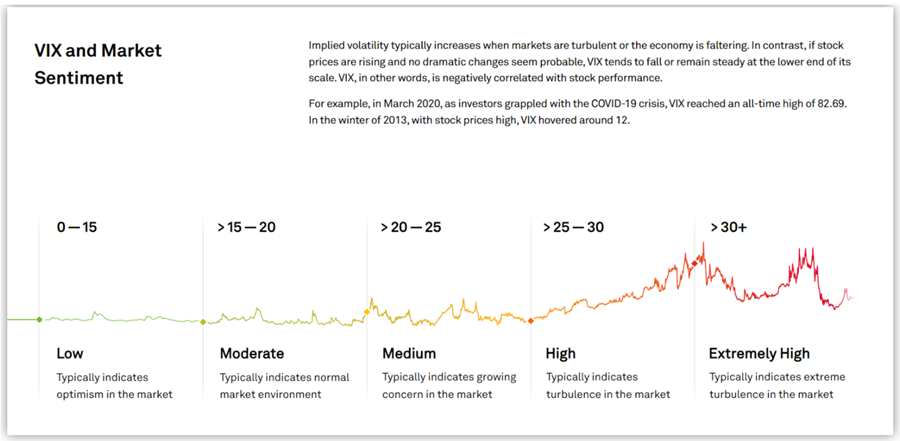
The VIX serves as a significant indicator of market sentiment. Understanding VIX values can guide your investment choices. Generally, when the VIX is at:

Source: spglobal.com
0-15: This range suggests a positive market outlook with very low volatility.
15-20: This indicates moderate volatility, signaling typical market conditions.
20-25: This range reflects rising concerns among investors, suggesting increasing volatility.
25-30: This level points to significant market fluctuations, with volatility on the rise.
30 and above: This indicates extreme market volatility, where large price swings may occur soon.
As an index, the VIX can be monitored and traded through various options and exchange-traded products. Investors can also use VIX readings to inform derivative pricing.
While the VIX itself cannot be bought like stocks or bonds, you can invest in instruments that react to its movements. Traders often use VIX options and futures to hedge their positions.
3. Historical volatility index data analysis
The analysis of historical VIX data reveals significant patterns, particularly during periods of market turmoil. The VIX, often referred to as the "fear index," tends to spike dramatically whenever the stock market faces crises. Below is a summary of VIX values during notable events:
Notable Events | VIX Value |
Asian Financial Crisis 1997 | 36.27 |
September 11 Attacks 2001 | 42.66 |
Financial Crisis 2008 | 79.13 |
European Debt Crisis 2010 | 40.95 |
U.S.-China Trade War 2018-2019 | 30.11 |
COVID-19 Pandemic 2020 | 66.04 |
As shown in the table, the VIX consistently rises during significant global socio-economic disruptions—most notably during the 2008 financial crisis when it approached a historic high of nearly 80. This trend underscores the market's extreme fear during turbulent times.
VIX Trends Around U.S. Presidential Elections
Another interesting phenomenon is the behavior of the VIX index leading up to U.S. presidential elections. Research indicates that the VIX typically trends upward in the months preceding an election. On average, the VIX is higher on election day compared to its value 60 days prior. This pattern reflects the uncertainty in the market as investors hedge against potential political changes.
After elections conclude, the VIX usually stabilizes and begins to decrease. However, if there’s a significant shift in the political landscape, the VIX may continue to rise. For instance, during the 2008 presidential election, the VIX nearly doubled in the two months leading up to November. After the election results were announced, the VIX continued to climb due to the Democratic Party's unexpected victory over the incumbent Republican Party.
The 2000 election is another pertinent example. Following the election, the VIX increased as the market digested the implications of an outgoing administration's change in policy direction.
In the 2020 presidential election, the VIX exhibited a typical pattern of rising before the election and falling afterward. It peaked at 41.16 on October 29, 2020, after reaching a low of 20.28 on August 11. Following the election in November, the index showed a significant downward trend.
The historical analysis of VIX data illustrates its critical role as an indicator of market sentiment during crises and political uncertainty. Understanding these patterns can provide valuable insights for investors navigating volatile market conditions.
4. How to use volatility index as a trading strategy
The Volatility Index (VIX) serves as a crucial gauge of market volatility and investor sentiment. By understanding and leveraging the VIX, traders can make more informed decisions and enhance their trading strategies. Here’s a guide on how to effectively incorporate the VIX into your trading approach.
Entry and Exit Points: Consider entering long positions when the VIX is low and exiting when it spikes. This approach capitalizes on the inverse relationship between the VIX and stock prices.
Protective Strategies: Use VIX options or ETFs to hedge your portfolio during periods of high volatility. Buying VIX calls can protect against potential losses in your equity holdings.
Trading VIX Options and Futures: Trade VIX options and futures for direct exposure to volatility. This allows you to profit from fluctuations in the VIX itself, rather than relying solely on stock prices.
Technical Analysis Pairing with Other Indicators: Combine VIX analysis with other technical indicators (like moving averages or RSI) to enhance your trading strategy. For instance, a rising VIX alongside a declining stock price can confirm bearish trends.
Reacting to Economic Events: Pay attention to economic announcements, earnings reports, or geopolitical events that may cause volatility spikes. Position your trades based on expected market reactions to these events.
Risk Management: Given the unpredictable nature of volatility, implement stop-loss orders to manage your risk effectively. This helps limit potential losses during sudden market movements.
Using the Volatility Index as part of your trading strategy can provide valuable insights into market dynamics and help you make informed decisions. By understanding how to interpret the VIX and implement it in your trading approach, you can enhance your ability to navigate volatile markets successfully. Always remember to conduct thorough research and manage your risk appropriately.
*Practical Applications:
One primary use is in hedging strategies, where investors employ the VIX to protect their portfolios against potential downturns. By taking positions in VIX futures or options, they can offset losses in other assets during periods of high market volatility.
Additionally, the VIX serves as a tool for speculative trading, allowing traders to profit from anticipated changes in market volatility. This speculative approach often involves short-term trades based on predictions of market sentiment shifts.
Furthermore, the VIX has given rise to a range of financial products, including futures, options, and exchange-traded funds (ETFs), which provide investors with more sophisticated means to engage with volatility. These products enable both hedging and speculative strategies, making the VIX a versatile instrument in modern financial markets.
5. Summary
The Volatility Index (VIX), often called the "fear index," is a key indicator of market volatility and investor sentiment. Traders can use the VIX to identify market conditions, determine entry and exit points, hedge against downturns, and make informed trading decisions. By analyzing VIX trends alongside other indicators and managing risk effectively, investors can navigate volatile markets more successfully.
6. FAQs
#How can I use the VIX to time my trades?
Traders often enter long positions when the VIX is low and consider exiting when it spikes, capitalizing on the inverse relationship between the VIX and stock prices.
#Can the VIX be traded directly?
Yes, traders can buy and sell VIX options and futures for direct exposure to volatility, allowing them to profit from VIX fluctuations.
#What role does the VIX play in risk management?
The VIX can be used to hedge against market downturns by purchasing VIX options, helping protect portfolios during periods of high volatility.
#Should I combine the VIX with other indicators?
Absolutely. Pairing VIX analysis with technical indicators like moving averages or RSI can provide a more comprehensive view of market trends and enhance trading strategies.
Before making any trading decisions, it is important to equip yourself with sufficient fundamental knowledge, have a comprehensive understanding of market trends, be aware of risks and hidden costs, carefully consider investment targets, level of experience, risk appetite, and seek professional advice if necessary.
Furthermore, the content of this article is solely the author's personal opinion and does not necessarily constitute investment advice. The content of this article is for reference purposes only, and readers should not use this article as a basis for any investment decisions.
Investors should not rely on this information as a substitute for independent judgment or make decisions solely based on this information. It does not constitute any trading activity and does not guarantee any profits in trading.
If you have any inquiries regarding the data, information, or content related to Mitrade in this article, please contact us via email: insights@mitrade.com. The Mitrade team will carefully review the content to continue improving the quality of the article.


