The Ultimate High-Yield Oil Stock to Buy With $500 Right Now

Source The Motley Fool

The price of Brent crude, a key global oil benchmark, has fallen by around 20% in the past seven months or so. That's a pretty big move but, historically speaking, such slides aren't all that unusual in the energy sector. That's why long-term income-focused investors would be well advised to buy shares of energy companies that are built to keep distributing large dividends even during periods of big commodity price swings.

Right now, the best stock pick from that elite group is probably Chevron (NYSE: CVX). Here's why.

What do integrated energy giants like Chevron do?

Chevron is one of the largest energy companies on the planet -- but that description doesn't really do it justice. Just saying "energy" is too vague because the energy sector is divided into three major segments: upstream (oil and natural gas production); midstream (energy transportation); and downstream (chemicals and refining).

Many energy companies operate in just one of these areas. Chevron and its integrated peers operate across all of them. This is important because the upstream, midstream, and downstream segments all have different business dynamics.

A road sign that read volatility ahead.

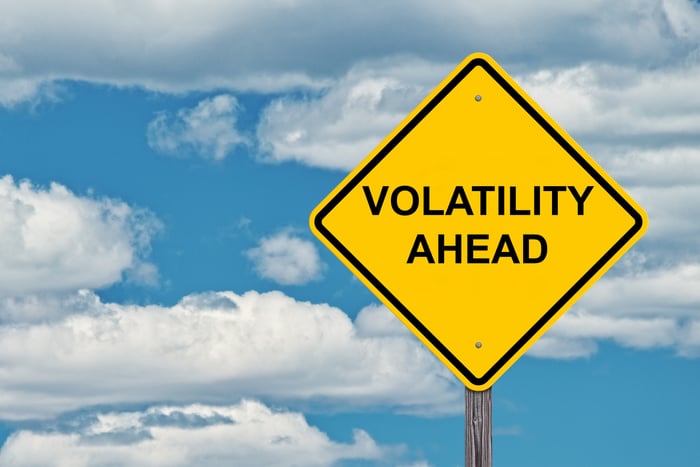
Image source: Getty Images.

The upstream and the downstream both tend to be volatile, with results driven by commodity prices. But the downstream segment often benefits when the upstream is suffering because oil and natural gas are key inputs into the chemical and refining businesses. Midstream assets, like pipelines, are largely toll-taking operations, so they usually perform fairly consistently over time.

Essentially, operating in all three areas helps integrated energy companies even out their business performances across the energy cycle. They will still have peaks and valleys, but they won't be quite as extreme as those experienced by companies that are only working in the upstream or the downstream arenas.

This is why more conservative investors looking at the energy sector should probably stick with integrated energy giants. The list of options generally includes Chevron, ExxonMobil (NYSE: XOM), Shell, BP, and TotalEnergies.

There are other integrated energy companies, like ENI, but national governments tend to have material ownership stakes in those companies, which can lead to decisions that are less shareholder friendly (and more government friendly).

Chevron is the best value in the integrated energy group today

With so many options, why should an income investor choose Chevron?

The first reason is the company's dividend history. BP and Shell both cut their dividends during the early days of the pandemic. At the time, both said that was so that they could invest more in clean energy, but they have already walked back the renewable power commitments they made during that period. It seems more likely at this point that Shell and BP just wanted more financial breathing room. If you want a dividend stock you can trust, these two likely shouldn't make your list.

TotalEnergies made a similar clean energy commitment, but maintained its dividend. While that fact should keep it on your options list, there's a confounding fact here. TotalEnergies has not walked back its clean energy commitment and, in fact, has pushed fairly hard into the sector, effectively diversifying away from oil and natural gas. It is an attractive energy company, but one that's really most appropriate for investors who want to hedge their carbon fuel bets with clean energy exposure.

That leaves Chevron and ExxonMobil, both of which have really stuck pretty close to their historical petrochemical focus.

CVX Debt to Equity Ratio Chart

CVX Debt to Equity Ratio data by YCharts.

There are a number of important similarities between Chevron and ExxonMobil. For example, they have the two lowest debt-to-equity ratios among their closest peers. And both have increased their dividend payments annually for decades. These aren't unrelated facts. Because they have strong balance sheets, they can take on debt as needed during tougher times to support their dividends and their businesses. When the good times return, which they always have historically, they can reduce their leverage in preparation for the next down cycle.

So, if you are looking for a reliable dividend-paying energy stock, either Chevron or ExxonMobil could fit the bill. But at their current share prices, Chevron's dividend yield is 4% while ExxonMobil's yield is 3.2%. With similar businesses but meaningfully different yields, Chevron stands out as the more attractive high-yield energy stock right now.

Prepare for the worst with energy stocks

The most important factor in the case for buying Chevron is that it has proven that it can weather the ups and downs of the energy sector. The secondary element is that, comparing it to its closest peer ExxonMobil, it has a more lucrative dividend. It wouldn't be wrong to buy ExxonMobil, but if you are trying to generate the most income with a $500 investment (or a $500,000 investment), Chevron simply looks to be the more rewarding pick today.

Don’t miss this second chance at a potentially lucrative opportunity

Ever feel like you missed the boat in buying the most successful stocks? Then you’ll want to hear this.

On rare occasions, our expert team of analysts issues a “Double Down” stock recommendation for companies that they think are about to pop. If you’re worried you’ve already missed your chance to invest, now is the best time to buy before it’s too late. And the numbers speak for themselves:

  • Nvidia: if you invested $1,000 when we doubled down in 2009, you’d have $352,678!*
  • Apple: if you invested $1,000 when we doubled down in 2008, you’d have $44,102!*
  • Netflix: if you invested $1,000 when we doubled down in 2004, you’d have $466,805!*

Right now, we’re issuing “Double Down” alerts for three incredible companies, and there may not be another chance like this anytime soon.

See 3 “Double Down” stocks »

*Stock Advisor returns as of November 25, 2024

Reuben Gregg Brewer has positions in TotalEnergies. The Motley Fool has positions in and recommends Chevron. The Motley Fool recommends BP. The Motley Fool has a disclosure policy.

Disclaimer: For information purposes only. Past performance is not indicative of future results.
placeholder
Gold Price Forecast: XAU/USD drifts higher above $4,200 as Fed delivers expected cutGold price (XAU/USD) gains momentum to around $4,235 during the early Asian session on Thursday. The precious metal extends its upside after the US Federal Reserve (Fed) delivered an expected third consecutive interest rate cut and maintained its outlook for just one cut in 2026.
Author  FXStreet
Dec 11, Thu
Gold price (XAU/USD) gains momentum to around $4,235 during the early Asian session on Thursday. The precious metal extends its upside after the US Federal Reserve (Fed) delivered an expected third consecutive interest rate cut and maintained its outlook for just one cut in 2026.
placeholder
Ethereum Price Slips Lower — $3,000 Looms as the Key BattlegroundEthereum is attempting to recover from a $3,026 low but remains below $3,200 and the 100-hour SMA, with a bearish trend line near $3,175 capping rebounds as bulls need a clean break above $3,200 to target $3,250–$3,400, while a drop below $3,050 risks a retest of $3,000 and $2,940.
Author  Mitrade
Dec 15, Mon
Ethereum is attempting to recover from a $3,026 low but remains below $3,200 and the 100-hour SMA, with a bearish trend line near $3,175 capping rebounds as bulls need a clean break above $3,200 to target $3,250–$3,400, while a drop below $3,050 risks a retest of $3,000 and $2,940.
placeholder
Bitcoin Slides 5% as Sellers Lean In — Can BTC Reclaim $88,000?Bitcoin has dropped back below $88,000 after rolling over from $90,500, with price still trading under the 100-hour Simple Moving Average. The sell-off found a floor at $85,151, and BTC is now consolidating near that base, but rebounds are facing pressure from a bearish trend line around $89,000. Bulls need to retake $88,000–$89,000 to ease downside risk; failure to do so keeps $85,500–$85,000 and then $83,500 in play, with $80,000 as the deeper “line in the sand.” Bitcoin (BTC) is back in damage-control mode after a sharp pullback wiped out recent gains. The price failed to reclaim the $90,000–$90,500 band, rolled over, and slid through $88,500 before briefly dipping under $87,000. Buyers did show up around $85,000, but the rebound so far looks more like stabilization than a clear trend reversal. Bitcoin dips hard, finds a bid near $85,000(h3) BTC’s latest move lower began when it couldn’t build follow-through above $90,000 and $90,500. Once that upside stalled, sellers took control and pushed price down through $88,500. The slide accelerated enough to spike below $87,000, but the market didn’t free-fall. Bulls defended the $85,000 zone, printing a low at $85,151. Since then, Bitcoin has been consolidating below the 23.6% Fibonacci retracement of the drop from the $93,560 swing high to the $85,151 low — a clue that the bounce is still shallow and that sellers haven’t fully backed off yet. Structurally, BTC is still on the back foot: It’s trading below $88,000, and It remains below the 100-hour Simple Moving Average, keeping short-term trend pressure pointed downward. Resistance is layered, and $89,000 is the problem area(h3) If bulls try to turn this into a recovery, they’ll have to climb through multiple ceilings in quick succession. First, BTC faces resistance around $87,150, followed by a more meaningful barrier near $87,500. From there, the market’s attention snaps back to $88,000 — the level BTC just lost and now needs to reclaim. A close back above $88,000 would improve the tone, but it doesn’t solve the bigger issue: there’s a bearish trend line on the hourly BTC/USD chart (Kraken feed) with resistance near $89,000, which also lines up with the next technical hurdle. If BTC can push through $89,000 and hold, the rebound could extend toward $90,000, with follow-through targets at $91,000 and $91,500. But until price clears that $88,000–$89,000 zone, rallies are at risk of being sold rather than chased. If BTC fails to reclaim resistance, the downside path is clear(h3) The near-term bear case is simple: if Bitcoin can’t climb back above the $87,000 area and keep traction, sellers may attempt another leg lower. Support levels line up like this: Immediate support: $85,500 First major support: $85,000 Next support: $83,500 Then $82,500 in the near term Below that, the major “don’t break this” level is still $80,000. If BTC slips under $80,000, the risk of acceleration to the downside increases significantly — not because it’s magic, but because it’s the kind of psychological and structural level that tends to trigger forced de-risking. Indicators: momentum still leans bearish(h3) The intraday indicators aren’t offering much comfort yet: Hourly MACD is losing pace in the bearish zone. Hourly RSI remains below 50, suggesting sellers still have the upper hand on short timeframes. So while the $85,000 defense held for now, the market hasn’t flipped bullish — it’s just stopped bleeding.
Author  Mitrade
Dec 16, Tue
Bitcoin has dropped back below $88,000 after rolling over from $90,500, with price still trading under the 100-hour Simple Moving Average. The sell-off found a floor at $85,151, and BTC is now consolidating near that base, but rebounds are facing pressure from a bearish trend line around $89,000. Bulls need to retake $88,000–$89,000 to ease downside risk; failure to do so keeps $85,500–$85,000 and then $83,500 in play, with $80,000 as the deeper “line in the sand.” Bitcoin (BTC) is back in damage-control mode after a sharp pullback wiped out recent gains. The price failed to reclaim the $90,000–$90,500 band, rolled over, and slid through $88,500 before briefly dipping under $87,000. Buyers did show up around $85,000, but the rebound so far looks more like stabilization than a clear trend reversal. Bitcoin dips hard, finds a bid near $85,000(h3) BTC’s latest move lower began when it couldn’t build follow-through above $90,000 and $90,500. Once that upside stalled, sellers took control and pushed price down through $88,500. The slide accelerated enough to spike below $87,000, but the market didn’t free-fall. Bulls defended the $85,000 zone, printing a low at $85,151. Since then, Bitcoin has been consolidating below the 23.6% Fibonacci retracement of the drop from the $93,560 swing high to the $85,151 low — a clue that the bounce is still shallow and that sellers haven’t fully backed off yet. Structurally, BTC is still on the back foot: It’s trading below $88,000, and It remains below the 100-hour Simple Moving Average, keeping short-term trend pressure pointed downward. Resistance is layered, and $89,000 is the problem area(h3) If bulls try to turn this into a recovery, they’ll have to climb through multiple ceilings in quick succession. First, BTC faces resistance around $87,150, followed by a more meaningful barrier near $87,500. From there, the market’s attention snaps back to $88,000 — the level BTC just lost and now needs to reclaim. A close back above $88,000 would improve the tone, but it doesn’t solve the bigger issue: there’s a bearish trend line on the hourly BTC/USD chart (Kraken feed) with resistance near $89,000, which also lines up with the next technical hurdle. If BTC can push through $89,000 and hold, the rebound could extend toward $90,000, with follow-through targets at $91,000 and $91,500. But until price clears that $88,000–$89,000 zone, rallies are at risk of being sold rather than chased. If BTC fails to reclaim resistance, the downside path is clear(h3) The near-term bear case is simple: if Bitcoin can’t climb back above the $87,000 area and keep traction, sellers may attempt another leg lower. Support levels line up like this: Immediate support: $85,500 First major support: $85,000 Next support: $83,500 Then $82,500 in the near term Below that, the major “don’t break this” level is still $80,000. If BTC slips under $80,000, the risk of acceleration to the downside increases significantly — not because it’s magic, but because it’s the kind of psychological and structural level that tends to trigger forced de-risking. Indicators: momentum still leans bearish(h3) The intraday indicators aren’t offering much comfort yet: Hourly MACD is losing pace in the bearish zone. Hourly RSI remains below 50, suggesting sellers still have the upper hand on short timeframes. So while the $85,000 defense held for now, the market hasn’t flipped bullish — it’s just stopped bleeding.
placeholder
December Santa Claus Rally: New highs in sight for US and European stocks?Historical data show a rising trend of US and European stocks in December. If the momentum is strong, fund managers may rush in with a buying frenzy.
Author  Mitrade
Yesterday 02: 50
Historical data show a rising trend of US and European stocks in December. If the momentum is strong, fund managers may rush in with a buying frenzy.
placeholder
XRP’s Price Action Flashes a Warning Even as ETF Flows Stay PositiveXRP’s structure remains weak despite 18 straight positive closes in spot XRP ETFs, with analysts warning that $1.98 and other nearby resistance zones could cap rebounds unless the YO region is reclaimed, while deeper downside scenarios keep $1.53 on watch as a potential (not guaranteed) accumulation area.
Author  Mitrade
22 hours ago
XRP’s structure remains weak despite 18 straight positive closes in spot XRP ETFs, with analysts warning that $1.98 and other nearby resistance zones could cap rebounds unless the YO region is reclaimed, while deeper downside scenarios keep $1.53 on watch as a potential (not guaranteed) accumulation area.
goTop
quote