


Is Donald Trump or Kamala Harris Better for Stocks? Statistically, One Party Has Overseen a Considerably Higher Average Annual Return Over the Last Century.
In a little over three weeks, voters from across the country will head to the polls to determine the direction of our great country over the coming four years.
Although not every action taken by the incoming president and Congress will have a bearing on Wall Street, the fiscal policy proposals ultimately put into place by the incoming administration will impact corporate America and the stock market.
Over the last two presidential terms, investors have done quite well. During Donald Trump's four years in the Oval Office, the ageless Dow Jones Industrial Average (DJINDICES: ^DJI), broad-based S&P 500 (SNPINDEX: ^GSPC), and innovation-inspired Nasdaq Composite (NASDAQINDEX: ^IXIC), respectively, gained 56%, 67%, and 138%!

Former President and Republican presidential nominee Donald Trump delivering remarks. Image source: Official White House Photo by Joyce N. Boghosian.
Meanwhile, the Dow Jones, S&P 500, and Nasdaq Composite rallied 36%, 50%, and 36%, respectively, during President Joe Biden's term, as of the closing bell on Oct. 10, 2024.
But with President Biden set to leave office in a little over three months, the million-dollar question becomes: Which candidate is better for stocks, Donald Trump or Kamala Harris?
Though history shows both parties are beneficial to equities, one party has overseen a notably higher average annual return for stocks over the last century.
Trump or Harris will inherit a historically pricey stock market
Before digging into party-dependent historical return data, it's important to recognize the challenge that awaits the next president. Despite nearing the second anniversary of the current bull market, America's next president will be inheriting one of the priciest stock markets on record.
While there are a lot of ways to measure value, the S&P 500's Shiller price-to-earnings (P/E) ratio -- also known as the cyclically adjusted price-to-earnings ratio (CAPE ratio) -- does a particularly good job of conveying just how pricey equities are at the moment.
Unlike the traditional P/E ratio, which can be easily skewed by shock events, the Shiller P/E takes into account average inflation-adjusted earnings over the previous 10 years. Looking back a full decade minimizes the impact of shock events and allows for apples-to-apples valuation comparisons.
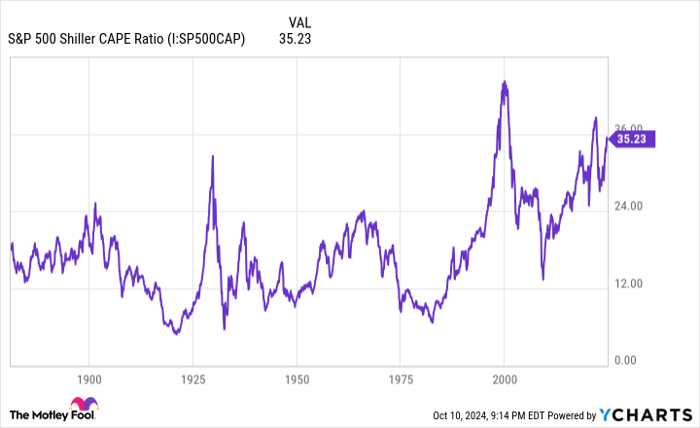
S&P 500 Shiller CAPE Ratio data by YCharts. CAPE Ratio = cyclically adjusted price-to-earnings ratio.
As of the closing bell on Oct. 10, the S&P 500's Shiller P/E was north of 37, representing the third-highest reading during a continuous bull market when back-tested to January 1871.
What's more, in 153 years, there have only been six occurrences when the S&P 500's Shiller P/E ratio has surpassed 30 during a bull market, including the present. Following the five previous instances, the Dow, S&P 500, and/or Nasdaq Composite lost between 20% and 89% of their value. In this respect, history is working against the candidate who wins in November.
There are other potential concerns, as well, beyond just the stock market being exceptionally pricey.
For example, we've borne witness to the longest yield-curve inversion in history. Normally, the Treasury yield curve slopes up and to the right, with bonds set to mature in 10 or 30 years sporting higher yields than bills maturing in a year or less. But when the yield curve inverts and short-term bills bear higher yields than long-term Treasury bonds, it's often a sign that economic turbulence is coming.
Additionally, the U.S. M2 money supply had its first notable year-over-year decline since the Great Depression in 2023. There have been only five instances when the M2 money supply has contracted by at least 2% on a year-over-year basis, including 2023, and the four prior occurrences all correlated with U.S. depressions and a double-digit unemployment rate.
Suffice it to say, neither candidate will be stepping into an ideal scenario come inauguration day.

Vice President and Democratic presidential nominee Kamala Harris delivering remarks. Image source: Official White House Photo by Lawrence Jackson.
Here's what history says regarding which candidate is better for stocks
With these challenges in mind, let's turn back to the question at hand: Is Donald Trump or Kamala Harris better for stocks?
Putting aside their policy proposals and how they might alter the landscape for corporate America, history shows a number of positive scenarios for investors, with one party notably outperforming the other.
Over the last 71 years, there have been 13 presidents (seven Republicans and six Democrats). Only two of these presidents (George W. Bush and Richard Nixon, both Republicans) oversaw a negative compound annual growth rate (CAGR) in the benchmark S&P 500 while in office. The average S&P 500 CAGR of the last seven Republican presidents is 6.2%, notably lower than the 9.6% mean S&P 500 CAGR for Democratic presidents.
This historic outperformance for Democratic Party presidents extends back roughly a century.
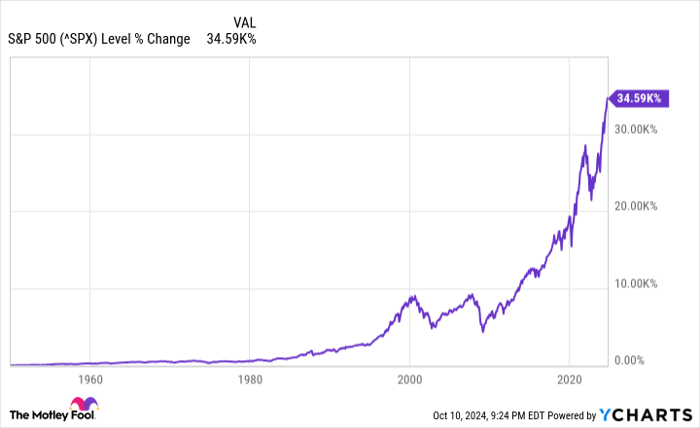
^SPX data by YCharts.
Based on data analyzed from 1926 through 2023 by Retirement Researcher, the average annual return for the S&P 500 under a unified (i.e., one party controlling both houses of Congress) or divided Congress is as follows:
- Unified Republican: 14.52% average annual return over 13 years
- Unified Democrat: 14.01% average annual return over 36 years
- Divided with Republican president: 7.33% average annual return over 34 years
- Divided with Democratic president: 16.63% average annual return over 15 years
Using this data, we can see that Republican presidents have overseen a very respectable 9.32% average annual return in the S&P 500 since 1926. However, Democratic presidents have enjoyed a considerably more robust average annual return of 14.78% in the S&P 500 during 51 years in the Oval Office.
Based purely on historical data and nothing else (note the italics!), a Kamala Harris victory in November would seem ideal for Wall Street.
Nevertheless, patience and perspective are far more important in determining investment returns than which party controls the Oval Office.
Historically speaking, time, and not any particular political party, is the greatest ally for investors. With periods of economic expansion lasting considerably longer than recessions, investors who wager on the U.S. economy to expand over long periods are set up for success.
What's more, an extensive study updated earlier this year by Crestmont Research examined the rolling 20-year total returns, including dividends, of the S&P 500 dating back to the start of the 20th century. Even though the S&P didn't exist until 1923, researchers were able to track the total return of its components from other indexes to 1900. This research yielded 105 rolling 20-year periods (1919-2023).
Crestmont found that all 105 rolling 20-year periods produced positive total returns. Put another way, if an investor had, hypothetically, purchased an S&P 500 index fund at any point since 1900 and held that position for 20 years, they made money, without fail, every time.
Despite the uncertainty that can accompany elections, investors who can exercise patience and perspective are perfectly positioned to thrive whether Donald Trump or Kamala Harris wins in November.
Don’t miss this second chance at a potentially lucrative opportunity
Ever feel like you missed the boat in buying the most successful stocks? Then you’ll want to hear this.
On rare occasions, our expert team of analysts issues a “Double Down” stock recommendation for companies that they think are about to pop. If you’re worried you’ve already missed your chance to invest, now is the best time to buy before it’s too late. And the numbers speak for themselves:
- Amazon: if you invested $1,000 when we doubled down in 2010, you’d have $21,266!*
- Apple: if you invested $1,000 when we doubled down in 2008, you’d have $43,047!*
- Netflix: if you invested $1,000 when we doubled down in 2004, you’d have $389,794!*
Right now, we’re issuing “Double Down” alerts for three incredible companies, and there may not be another chance like this anytime soon.
See 3 “Double Down” stocks »
*Stock Advisor returns as of October 7, 2024
Sean Williams has no position in any of the stocks mentioned. The Motley Fool has no position in any of the stocks mentioned. The Motley Fool has a disclosure policy.
Recommended Articles


