


Here's the Average Stock Market Return With Democratic and Republican Presidents in the White House
The S&P 500 (SNPINDEX: ^GSPC) is one of three major U.S. financial indexes. It measures the performance of 500 large domestic companies that cover about 80% of domestic equities by market value. Its scope and diversity make it the best gauge for the overall U.S. stock market.
In 2024, the S&P 500 advanced more than 20% through the end of the third quarter, the strongest year-to-date performance of the 21st century, according to JPMorgan Chase. That momentum has been driven by economic resilience and euphoria about artificial intelligence, as well as excitement about the Federal Reserve's recent interest rate cuts.
However, the next presidential election is just one month away, and many investors are curious about the potential implications. Read on to learn how the S&P 500 has performed with Democratic and Republican presidents in the White House.
The average stock market return under Democratic and Republican presidents
Since its inception in 1957, the S&P 500 has increased 12,950% in value, compounding at 7.4% annually. That compound annual growth rate (CAGR) is based on the price return of the index, meaning it does not account for dividend payments doled out along the way. The total return, including dividend payments, would be higher.
The chart below shows the S&P 500's CAGR during each presidency since the index was created. It also shows the median CAGR under Democratic and Republican presidents.
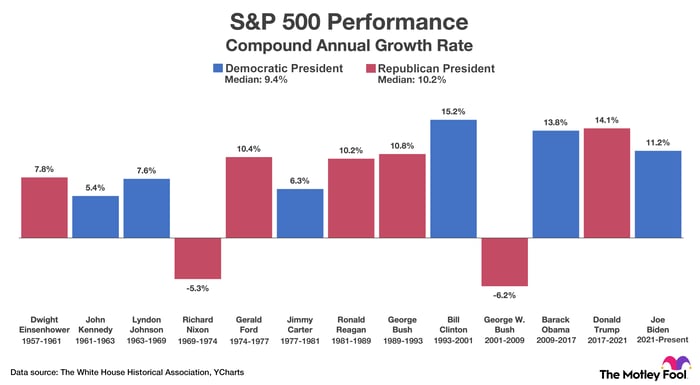
Data source: YCharts and the White House Historical Association (inauguration dates). Shown above is the S&P 500's compound annual growth rate during Democratic and Republican presidencies.
As shown in the chart, the S&P 500 has achieved a median CAGR of 10.2% under Republican presidents and 9.4% under Democratic presidents. In that sense, the U.S. stock market has performed a little better during periods when Republicans have controlled the White House.
However, we can also look at the problem from a different perspective. Specifically, instead of analyzing the CAGR during entire presidencies, we can examine the return in each individual year. The chart below shows the S&P 500's return in each individual year since March 1957. It also shows the median annual return when Democrats and Republicans held the presidency.
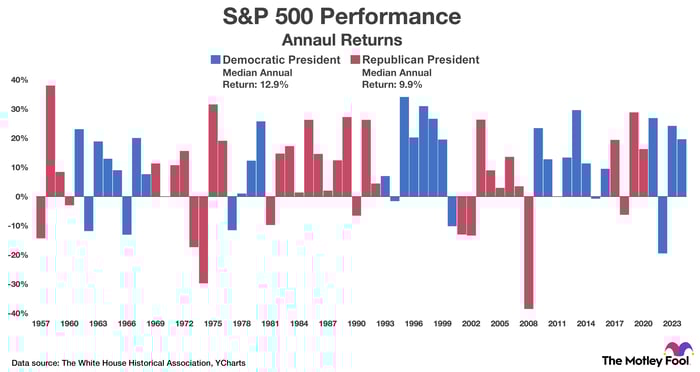
Data source: YCharts. Shown above is the S&P 500's annual return under Democratic and Republican presidents.
As shown above, the S&P 500 has achieved a median annual return of 12.9% under Democratic presidents and 9.9% under Republican presidents. In that sense, the U.S. stock market has done a little better during periods when Democrats have controlled the White House.
Bear in mind that presidents control neither the stock market nor the economy. Their influence is limited to nominations and budget proposals. For instance, the president nominates the seven members of the Federal Reserve's Board of Governors, but those candidates must be confirmed by lawmakers in the Senate.
Additionally, Kamala Harris has proposed raising the corporate tax rate, and Donald Trump has proposed the opposite. Both changes could impact the stock market and the economy. However, Congress has the final say regarding budget proposals, and lawmakers have no obligation to approve specific policies.
Furthermore, some events that influence the stock market and economy are beyond the control of any elected or appointed official. Consider the dot-com bubble, the global financial crisis, and the COVID-19 pandemic. All those events influenced the stock market and economy, and no single person could have prevented them.
History says patient investors will be well rewarded regardless of who wins the presidential election
There are two key takeaways for investors. First, statistics can be manipulated to achieve a desired outcome. As discussed, the stock market has performed better under Republicans in terms of the median CAGR across entire presidencies, but it has performed better under Democrats in terms of median return across individual years. Both statements are true, but they arrive at opposite conclusions.
Second, avoiding the stock market because one political party controls the White House would be a mistake. After examining returns since the 1950s, analysts at Goldman Sachs concluded: "Investing in the S&P 500 only during Republican or Democratic presidencies would have resulted in major shortfalls versus investing in the index regardless of the political party in power."
Here's the bottom line: The S&P 500 achieved a total return of 2,090% over the last 30 years, which equates to an annual return of 10.8%. That period encompasses such a broad range of economic and market conditions that investors can expect similar returns over the next three decades. In that context, the U.S. stock market is a smart place to invest money regardless of which party wins the presidential election in November.
Should you invest $1,000 in S&P 500 Index right now?
Before you buy stock in S&P 500 Index, consider this:
The Motley Fool Stock Advisor analyst team just identified what they believe are the 10 best stocks for investors to buy now… and S&P 500 Index wasn’t one of them. The 10 stocks that made the cut could produce monster returns in the coming years.
Consider when Nvidia made this list on April 15, 2005... if you invested $1,000 at the time of our recommendation, you’d have $765,523!*
Stock Advisor provides investors with an easy-to-follow blueprint for success, including guidance on building a portfolio, regular updates from analysts, and two new stock picks each month. The Stock Advisor service has more than quadrupled the return of S&P 500 since 2002*.
See the 10 stocks »
*Stock Advisor returns as of September 30, 2024
JPMorgan Chase is an advertising partner of The Ascent, a Motley Fool company. Trevor Jennewine has no position in any of the stocks mentioned. The Motley Fool has positions in and recommends Goldman Sachs Group and JPMorgan Chase. The Motley Fool has a disclosure policy.
Recommended Articles


