
Australian Dollar holds ground, upside appears due to weakening US economic conditions
- The Australian Dollar could advance as the US Dollar struggles after the Fed’s Beige Book suggested weakening economic conditions.
- President Trump said that the US will set the tariff rates for China over the next two to three weeks.
- The US Dollar struggles following the release of mixed S&P Global Purchasing Managers Index on Wednesday.
The Australian Dollar (AUD) remains steady on Thursday following two consecutive days of losses. The AUD/USD pair could see gains as the US Dollar (USD) faces pressure after the Federal Reserve's (Fed) Beige Book suggested weakening economic conditions.
According to the Fed’s April Beige Book, concerns over tariffs have worsened the economic outlook across several regions in the United States (US). Consumer spending presented a mixed picture, while the labor market showed signs of softening, with many districts reporting flat or slightly declining employment levels.
US President Donald Trump stated that it's up to China how soon tariffs can be reduced. Trump mentioned that the US will determine the tariff rates for China over the next two to three weeks. "If we don't reach a deal, we're simply setting the price — then it's up to them to decide if they want to proceed," he said. He also noted that China currently isn’t doing any business with the US, adding that the tariff rate remains at 145%. However, National Economic Council Director Hassett said on Wednesday that a full China-US trade deal could take 2-3 years.
The preliminary data from Australia’s Judo Bank on Wednesday showed that private sector activity grew for the seventh straight month in April, supported by continued expansion in both manufacturing and services.
Australian Dollar stays silent as US Dollar struggles following mixed PMI data
- The US Dollar Index (DXY), which measures the USD against six major currencies, edges lower after registering gains in the previous two successive sessions, trading near 99.60 at the time of writing. The Greenback faced headwinds following the release of mixed S&P Global Purchasing Managers Index (PMI) on Wednesday.
- The flash S&P Global Composite PMI for April dropped to 51.2 from 53.5, indicating a slowdown in overall business activity. Although the Manufacturing PMI inched up to 50.7, the Services PMI declined sharply to 51.4 from 54.4, pointing to softening demand in the services sector.
- S&P Global’s Chris Williamson commented that growth momentum is losing steam, while persistent inflationary pressures continue to complicate the Federal Reserve’s efforts to strike a balance.
- National Economic Council Director Kevin Hassett, President Trump's chief economic adviser, stated that the US Trade Representative (USTR) has 14 meetings scheduled with foreign trade ministers. Hassett also noted that 18 written proposals have been received from these ministers. According to Hassett, China remains open to negotiations.
- The US Dollar strengthened, supported by comments from US Treasury Secretary Scott Bessent, who described the ongoing tariff standoff as “unsustainable,” suggesting a potential move toward de-escalation.
- Market sentiment was boosted by US President Donald Trump, who reassured investors that he has no intention of removing Federal Reserve (Fed) Chair Jerome Powell, helping ease concerns about central bank independence and policy direction.
- President Trump also expressed optimism about ongoing trade negotiations with China, stating that discussions were progressing well. Trump added that while tariffs on Chinese goods wouldn’t be as high as 145%, they also wouldn’t be eliminated entirely.
- The White House announced on Tuesday that the Trump administration is making headway in negotiating trade deals aimed at easing the broad tariffs introduced earlier this month. According to US Press Secretary Karoline Leavitt, 18 countries have already submitted trade proposals to the US, and President Trump’s trade team is scheduled to meet with representatives from 34 nations this week to explore potential agreements.
- Federal Reserve Board Governor Adriana Kugler stated on Tuesday that the unexpectedly large US import tariffs are likely to push prices higher. As reported by Reuters, Kugler emphasized that the Federal Reserve should maintain current short-term interest rates until inflationary pressures begin to ease.
- The Judo Bank Manufacturing PMI edged down to a two-month low of 51.7 in April, compared to 52.1 in March. While manufacturing output remained in expansion territory, the increase in new orders was modest. Meanwhile, the Services PMI dipped slightly to 51.4 from 51.6 in the previous month, and the Composite PMI also eased to 51.4 from 51.6.
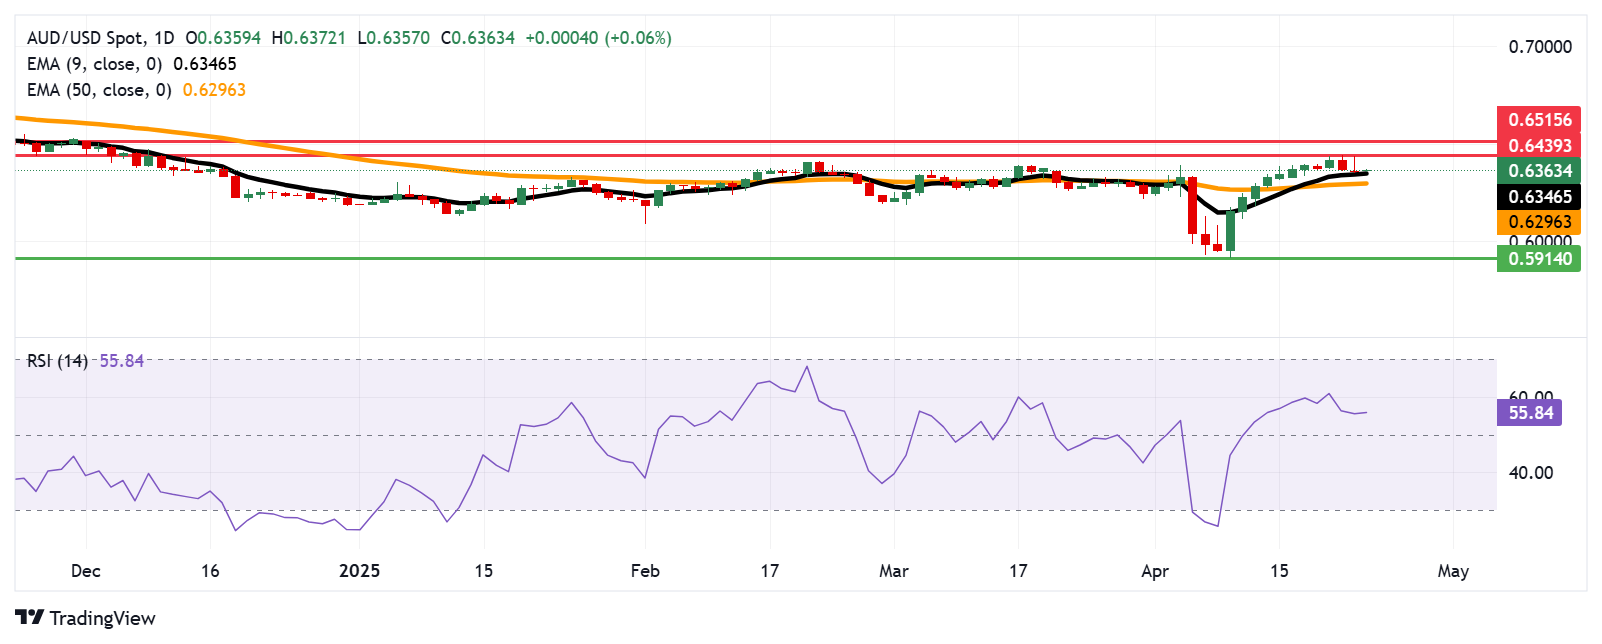
Australian Dollar tests 0.6350 support near nine-day EMA
The AUD/USD pair is trading near 0.6360 on Thursday, with technical indicators on the daily chart reflecting a bullish tone. The pair continues to hold above the nine-day Exponential Moving Average (EMA), while the 14-day Relative Strength Index (RSI) remains steady above 50, suggesting sustained upward momentum.
On the upside, immediate resistance is seen at the recent four-month high of 0.6439, marked on April 22. A decisive break above this level could pave the way for a rally toward the five-month high of 0.6515.
The AUD/USD pair is testing immediate support at the nine-day EMA of 0.6346, with stronger support near the 50-day EMA at 0.6296. A sustained drop below these levels would undermine the bullish setup and could lead to deeper losses, potentially exposing the March 2025 low around 0.5914.
AUD/USD: Daily Chart
Australian Dollar PRICE Today
The table below shows the percentage change of Australian Dollar (AUD) against listed major currencies today. Australian Dollar was the strongest against the US Dollar.
| USD | EUR | GBP | JPY | CAD | AUD | NZD | CHF | |
|---|---|---|---|---|---|---|---|---|
| USD | -0.35% | -0.23% | -0.40% | -0.12% | -0.04% | -0.08% | -0.33% | |
| EUR | 0.35% | 0.12% | -0.02% | 0.23% | 0.30% | 0.27% | 0.02% | |
| GBP | 0.23% | -0.12% | -0.13% | 0.11% | 0.19% | 0.15% | -0.10% | |
| JPY | 0.40% | 0.02% | 0.13% | 0.25% | 0.35% | 0.27% | 0.09% | |
| CAD | 0.12% | -0.23% | -0.11% | -0.25% | 0.11% | 0.06% | -0.21% | |
| AUD | 0.04% | -0.30% | -0.19% | -0.35% | -0.11% | -0.04% | -0.29% | |
| NZD | 0.08% | -0.27% | -0.15% | -0.27% | -0.06% | 0.04% | -0.26% | |
| CHF | 0.33% | -0.02% | 0.10% | -0.09% | 0.21% | 0.29% | 0.26% |
The heat map shows percentage changes of major currencies against each other. The base currency is picked from the left column, while the quote currency is picked from the top row. For example, if you pick the Australian Dollar from the left column and move along the horizontal line to the US Dollar, the percentage change displayed in the box will represent AUD (base)/USD (quote).
Economic Indicator
RBA Bulletin
The Bulletin, published by Reserve Bank of Australia, contains articles and speeches that discuss economic and financial developments as well as the Bank's operations. Published monthly until December 2009 and thereafter quarterly.
Read more.Last release: Thu Apr 24, 2025 01:30
Frequency: Quarterly
Actual: -
Consensus: -
Previous: -
Source: Reserve Bank of Australia
Recommended Articles


