
Understanding the Fed’s Overnight Reverse Repo(RRP), What Is the Relationship Between QT and Debt Ceiling
TradingKey - As the U.S. enters a new rate-cutting cycle, the quantitative tightening (QT)—initially launched to reduce the Federal Reserve’s bloated balance sheet following the COVID-19 pandemic—is also nearing its conclusion. A key metric in gauging when to end QT is the scale of the Fed’s overnight reverse repo (ON RRP) operations, which serve as an important indicator of excess liquidity in the financial system.
In the early stages of the Trump 2.0 administration, beyond the widely discussed tariff and tax cut proposals, attention has increasingly turned to the Fed’s monetary policy direction and the handling of the government debt ceiling. These macroeconomic levers are seen as pivotal in shaping have frequently become hot topics. These macroeconomic levers are seen as playing a pivotal role in shaping market liquidity conditions.
In March 2025, the Fed announced it would slow the pace of QT by lowering the monthly cap on Treasury securities maturing without reinvestment. Fed Chair Powell explained that committee members had observed some signs of growing stress in money markets. By mid-April, usage of the Fed’s overnight reverse repo agreements dropped below $600 billion, marking its lowest level since 2021.
Economists warn that the Fed must cease balance sheet reduction before the reverse repo mechanism is fully depleted. Failure to do so could risk a repeat of the 2019 "repo crisis," when liquidity evaporated rapidly, short-term market rates spiked, and financial markets experienced heightened volatility.
What Is a Reverse Repo?
Repurchase agreements (repos) and reverse repurchase agreements (reverse repos) are common monetary policy tools used by central banks in open market operations. In the U.S., a repo involves the Fed purchasing securities or other high-quality assets from financial institutions, with an agreement to sell them back at a later date. Conversely, a reverse repo entails the Fed selling securities with a promise to repurchase them later.
In essence, the Fed’s repo injects liquidity into the financial system and helps lower short-term interest rates, while a reverse repo withdraws liquidity and exerts upward pressure on rates. Notably, the operational direction of China’s reverse repo mechanism differs from that of the U.S.—China’s central bank uses repos to drain liquidity and reverse repos to inject it.
The Fed’s Overnight Reverse Repo Facility (ON RRP) is designed to absorb excess liquidity from non-bank financial institutions.
The overnight reverse repo acts as a form of "reserve account" for entities such as money market funds, primary dealers, insurance companies, and investment banks, serving as a "buffer" for bank reserves.
Under the Fed’s current framework, funds deposited by depository institutions in the Fed system are classified as reserve balances, while funds from non-bank entities are reflected through overnight reverse repo agreements.
Both types of funds—bank and non-bank—are listed under the "liabilities" on the Fed’s balance sheet. The Fed pays interest on reserve balances (IORB) and the overnight reverse repo rate (ON RRP).
These two artificially set interest rates form the Fed’s interest rate corridor: IORB serves as the upper bound, ON RRP functions as the lower bound, and the effective federal funds rate (EFFR) typically fluctuates within this range.
- IORB Rate (Upper Bound): When market rates—such as the EFFR— exceed IORB, banks are incentivised to lend in the open market or avoid borrowing altogether. This reduces the demand for funds and pulls market rates down, typically capping them at or below the IORB. Conversely, when market rates fall below IORB, banks can arbitrage by borrowing at lower rates in the market and depositing the money at the Fed to earn the higher IORB interest, pushing market rates up toward the IORB.
- ON RRP Rate (Lower Bound): When market rates drop below the ON RRP rate, non-bank institutions are disincentivised from lending in the market, as they can earn higher returns by placing funds with the Fed through reverse repos. This reduces market liquidity and pushes rates higher.
For example, if the current federal funds rate target range is 4%–4.25%, then IORB is 4.25% (upper bound), and ON RRP is 4% (lower bound). If the market rate rises to 4.5%, banks will borrow from the Fed at 4.25% and lend in the market at 4.5%, increasing supply and putting downward pressure on market rates. Conversely, if the market rate drops to 3.8%, non-bank financial institutions will opt to earn the 4% ON RRP rate by placing funds with the Fed, rather than lending in the open market.
What Do Rising and Falling Overnight Reverse Repo Volumes Mean?
After the COVID-19 pandemic in 2020, the Fed implemented quantitative easing (QE) by purchasing large volumes of U.S. Treasuries and mortgage-backed securities. Its balance sheet surged from 4.2 trillion in early 2020 to 8.9 trillion by mid-2022.
During this period of QE, non-bank institutions, such as money market funds, accumulated an amount of idle cash. With few higher-yielding investment alternatives, this excess liquidity was absorbed by the Fed through the overnight reverse repo facility. Consequently, ON RRP volumes soared—from a few hundred million dollars in early 2021 to $2.6 trillion by the end of 2022.
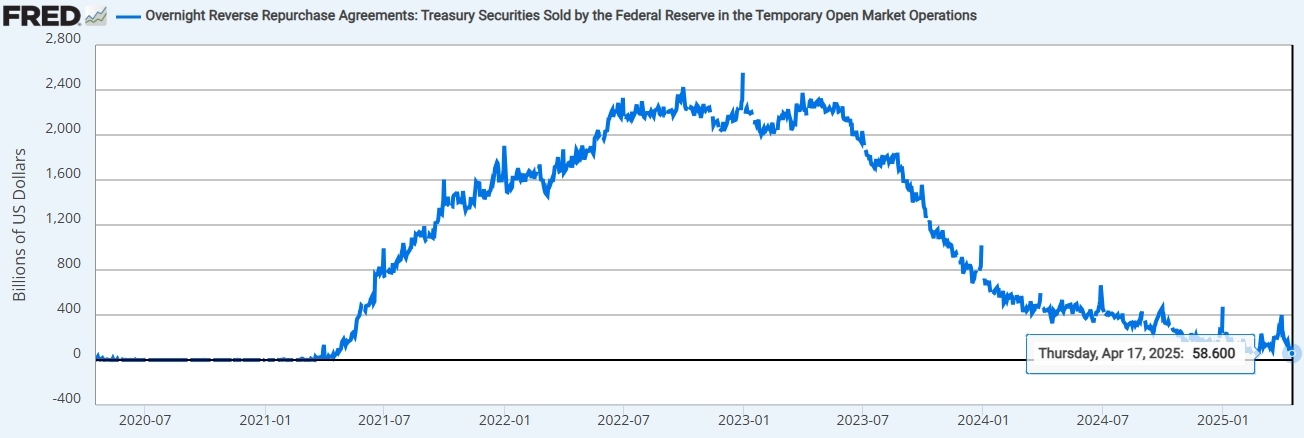
Overnight Reverse Repurchase Agreements, Source: stlouisfed
As the Fed began raising interest rates in March 2022 and initiated balance sheet tapering in June, ON RRP initially continued to absorb idle funds due to rising rates. However, as liquidity tightened amid aggressive rate hikes, ON RRP volumes peaked in late 2022 and have been declining since.
With inflation easing and liquidity tightening, the Fed began planning for monetary policy normalization—including rate cuts and the eventual end of QT. In June 2024, the Fed slowed the pace of QT, further reducing it in March 2025. As ON RRP volumes—an indicator of excess liquidity—have shrunk to mere hundreds of billions of dollars, Wall Street has begun to speculate on when the Fed might fully conclude QT.
If ON RRP usage falls to zero while QT continues, and bank reserves also decline or are potentially depleted by QT, the financial system could face a liquidity crunch. This scenario could lead to spikes in overnight repo rates, volatility in short-term bond markets, and disruptions in the stock market.
Thus, overnight reverse repos are viewed as a product of excess system liquidity, functioning as a "reservoir" for idle funds within the financial ecosystem.
- Reasons for Rising ON RRP Volumes: Abundant liquidity, such as during QE cycles; attractive ON RRP rates compared to low-yielding short-term investments; reduced supply of short-term Treasuries, as seen during the pandemic.
- Impact of Rising ON RRP Volumes: Excessive ON RRP volumes may signal the need for tighter monetary policy.
- Reasons for Declining ON RRP Volumes: Tightening liquidity, such as during QT cycles; low ON RRP rates relative to higher market rates.
- Impact of Declining ON RRP Volumes: Persistent declines may indicate the need for looser monetary policy.
How to Assess Liquidity Conditions?
Bank reserves are one of the most critical indicators for assessing liquidity conditions in the U.S. financial system. Fed Governor Christopher Waller once suggested that a reserve-to-GDP ratio of 10%–11% might represent a comfortable liquidity state.
Based on the 2017–2019 QT experience:
- A reserve-to-GDP ratio above 10% indicates excess reserves.
- A ratio of 8%–10% suggests adequate reserves.
- A ratio of 6%–8% signals a shortage.
- Below 6%, reserves are critically scarce, potentially triggering a "repo crisis."
During the September 2019 repo crisis, the reserve-to-GDP ratio fell below 7%, causing repo rates to spike to 10%. In response, the Fed launched emergency overnight repo operations and resumed purchasing short-term Treasuries to inject liquidity into the system.
The crisis stemmed from a combination of insufficient reserves due to QT and several temporary liquidity shocks: QT had already reduced the level of reserves in the banking system. Meanwhile, corporate tax payments transferred large sums from private accounts to the Treasury’s General Account (TGA), and Treasury auctions further absorbed market liquidity.
In October 2024, the New York Fed introduced a new metric to assess banking system liquidity: Reserve Demand Elasticity (RDE).
- When reserves are abundant, the reserve demand curve has a slope of zero, meaning the federal funds rate does not change with reserve levels.
- When reserves are scarce, RDE turns negative, making the federal funds rate highly sensitive to reserve changes.
Other indicators for assessing liquidity include:
- Overnight Reverse Repo: A sign of excess liquidity; rising ON RRP volumes indicate ample liquidity, while falling volumes signal tightness.
- Federal Funds Rate: The overnight interbank lending rate set by the FOMC; if the effective rate approaches or exceeds the upper bound, liquidity is tight; below the lower bound indicates ample liquidity.
- Money Supply: Changes in M2 or M3 reflect the effects of central bank policy and credit expansion; rapid growth indicates ample liquidity, while slowing growth signals tightness.
- TED Spread: Measures the difference between three-month LIBOR and three-month Treasury rates; widening spreads indicate declining trust among banks and tight liquidity.
When Will the Fed End QT?
Economists generally agree that the Fed should fully end QT when overnight reverse repo volumes approach zero. However, some experts caution that waiting until that point may be too late, advocating for an earlier cessation of QT to avoid liquidity stress.
Following the Fed’s March 2025 announcement to pause QT starting April 1, Wall Street remains divided on the likely timeline for a full conclusion. Bank of America predicts an end by December 2025, while JPMorgan and Deutsche Bank forecast Q1 2026. Barclays, meanwhile, expects QT to conclude by June 2026.
Why Does the Debt Ceiling Matter for Ending QT?
At the March 2025 FOMC meeting, members noted that pausing or slowing balance sheet reduction until the debt ceiling issue is resolved might be appropriate. Wall Street analysts, including those at Bank of America and JPMorgan, have also frequently highlighted the debt ceiling.
The debt ceiling is the maximum amount of debt the U.S. government is legally allowed to issue, as determined by Congress. Following its reinstatement in January 2025, the Treasury has relied on TGA and has used extraordinary measures to continue meeting financial obligations.
Like bank reserves, the Treasury General Account (TGA) is a liability on the Fed’s balance sheet. It holds government revenues from sources such as taxes, bond issuance, and other fiscal inflows, which are used to fund government expenditures.
- When TGA balances increase, funds flow from the private sector to the government.
- When TGA balances decrease, funds flow from the government to the private sector.
During periods when the debt ceiling is binding, the Treasury draws down its TGA account to meet its obligations. This process injects liquidity into the financial system, as funds flow into private-sector bank accounts, boosting reserve balances.
Once the debt ceiling is raised or suspended, the Treasury typically acts swiftly to rebuild its cash reserves—one of the largest liabilities on the Fed’s balance sheet—by issuing new debt. This activity withdraws liquidity from the banking system, tightening overall financial conditions.
As a result, the debt ceiling introduces significant uncertainty into the Fed’s QT timeline. Officials at the New York Fed have warned that a prolonged debt ceiling standoff could disrupt balance sheet reduction efforts, trigger volatility in central bank liabilities, and impact money market rates.
Summary
The Fed’s overnight reverse repo is a short-term liquidity management tool that allows non-bank institutions to park idle funds, with the Fed paying interest at the ON RRP rate. This rate serves as the lower bound of the Fed’s interest rate corridor. Rising ON RRP volumes reflect excess liquidity during periods of QE and may also increase in the early stages of QT due to higher rates. Markets anticipate that when ON RRP usage approaches zero, the Fed will conclude QT. However, the debt ceiling introduces added pressure on short-term liquidity and the pace of policy normalisation.
Recommended Articles


