
Pudgy Penguins extends rally as open interest, trading volume hit three-month highs
- Pudgy Penguins extends its gains on Monday after soaring 156% last week.
- PENGU’s open interest and trading volume reach three-month highs, indicating bullish sentiment prevails.
- The technical outlook suggests a continuation of the rally, targeting the $0.014 mark.
Pudgy Penguins (PENGU) – a meme coin based on penguins on the Solana (SOL) blockchain – is extending its gains by 5%, trading around $0.013 at the time of writing on Monday, after soaring 156% last week. On-chain metrics support the bullish sentiment as PENGU’s open interest and trading volume reached a three-month high. The technical outlook also looks positive, targeting the $0.014 mark before potentially reaching $0.017.
PENGU soars over 150% as on-chain data show bullish bias
Pudgy Penguins, which started as a Non-Fungible Token (NFT) project on Ethereum and later launched its Solana-based token PENGU, soared more than 156% last week. According to CoinGecko data, the penguin-based memecoin rallied over 35% in the last 24 hours. This recent price surge coincides with World Penguin Day on Friday, suggesting that traders may be engaging in speculative activities tied to this event.

PENGU chart. Source: CoinGecko
Still, when looking at its on-chain data, the outlook for PENGU looks bullish. Coinglass’ data shows that the futures’ OI in PENGU at exchanges rose from $49.92 million on Friday to $133.68 million on Monday, the highest level since January 28. An increasing OI represents new or additional money entering the market and new buying, which could add fuel to the current rally in the Pudgy Penguins price.
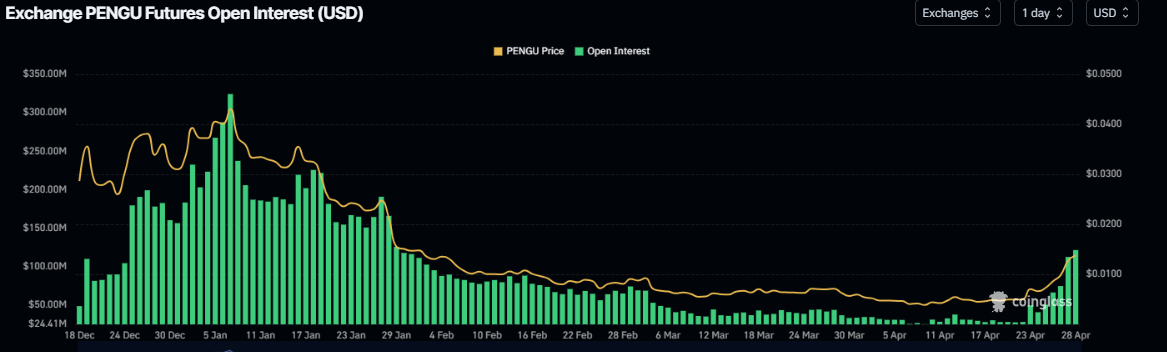
PENGU open interest chart. Source: Coinglass
Another aspect bolstering the platform’s bullish outlook is a recent surge in traders’ interest and liquidity in the Pudgy Penguins. Santiment data shows that PENGU’s trading volume rose from $155.68 million on Saturday to $517.53 million on Monday, the highest since January 19.
 [10-1745824615622.48.39, 28 Apr, 2025].png)
PENGU trading volume chart. Source: Santiment
Pudgy Penguins Price Forecast: PENGU bulls aiming for the $0.014 mark
Pudgy Penguins broke above the weekly resistance at $0.009 on Saturday and rallied 47.58% until Sunday, closing above its next daily resistance at $0.010. At the time of writing on Monday, it is extending its gains by 5% at around $0.013.
If PENGU continues its upward momentum, it could retest its next resistance level at $0.014 before potentially reaching the February 1 high of $0.017.
The Relative Strength Index (RSI) momentum indicator on the daily chart reads at 84, above its overbought level of 70, suggesting the ongoing rally could be overstretching. However, the bullish momentum appears to remain strong.
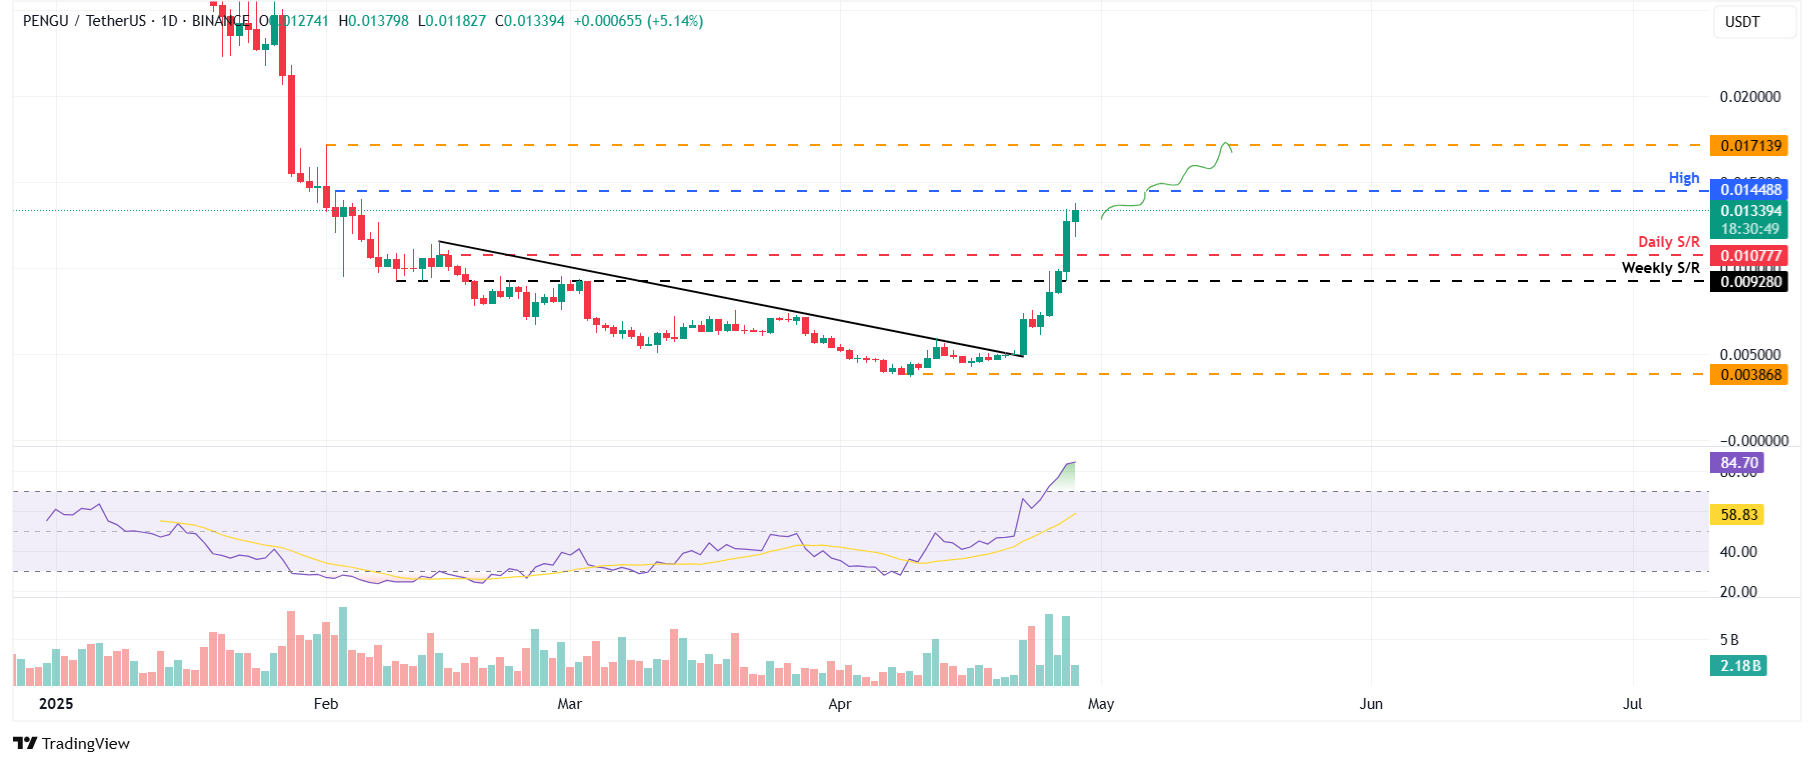
PENGU/USDT daily chart
If PENGU faces a correction, it could extend the decline to find support around its daily level at $0.010.
Recommended Articles


