EUR/USD remains well bid around 1.1350 ahead of US PPI

Source Fxstreet
  • The pair advanced to the vicinity of the 1.1500 hurdle earlier in the day.
  • The Greenback loses further ground and breaks below key contention levels.
  • US Producer Prices will be in the limelight later in the day.

Global trade concerns, US stagflation jitters hurt the Dollar

The US Dollar (USD) took another hit at the end of the week, after China retaliated with 125% tariffs on imports of US goods starting as soon as on April 12.

Indeed, unabated concerns over a more-likely-than-not global trade war in combination with escalating fears that the US economy could face a stagflationary scenario continue to undermine the Greenback, sending the US Dollar Index (DXY) to levels last seen three years ago below the psychological 100.00 level.

Against that backdrop, EUR/USD's upside impulse picked up pace and approached the key 1.1500 hurdle during early trade for the first time since February 2022.

Earlier in the day, the ECB’s C. Lagarde noted that the central back keeps closely following the developments around the US trade policies and emphasised the bank’s readiness to use all available instruments to procure price stability.

Accompanying the sharp uptick in spot, US yields reverse some of Thursday’s gains, while the German 10-year bund yields retreat to multi-day troughs around 2.55%.

What’s next

Later on Friday, the focus is expected to remain on US inflation with the release of Producer Prices for the month of March, while the advanced print of US Michigan Consumer Sentiment is also seen gathering attention, particularly its inflation component.

The day so far

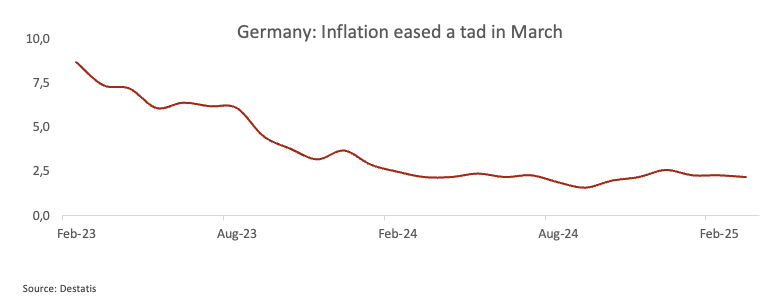
Germany’s final Inflation Rate saw the CPI rise 2.2% in the year to March and 0.3% vs. the previous month.

Levels to watch

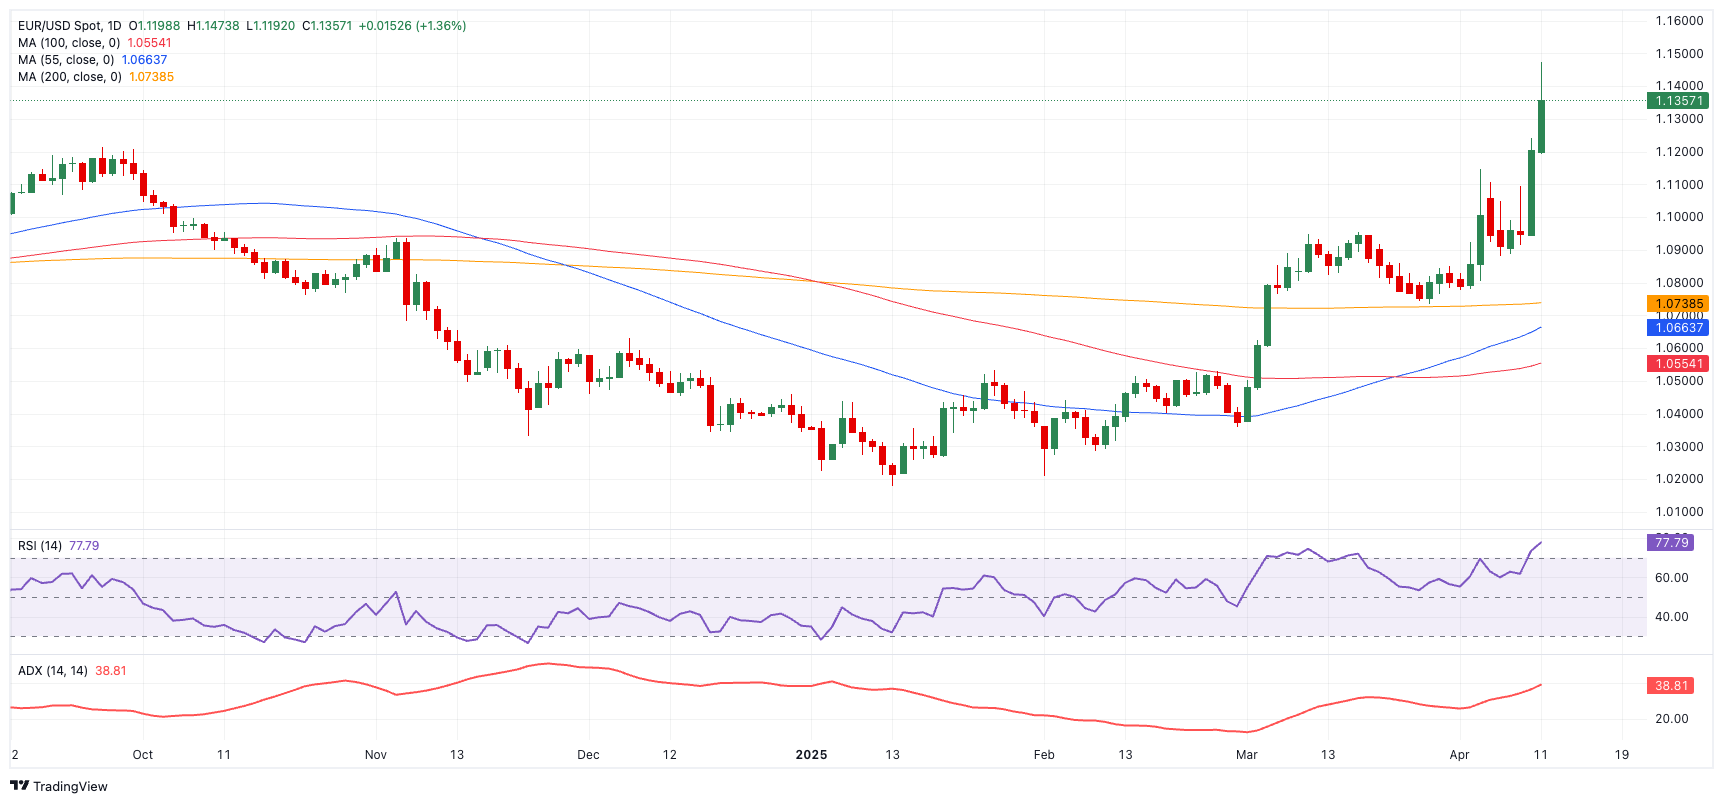
EUR/USD now faces immediate resistance at its 2025 peak at 1.1473 (April 11), seconded by the 2022 high at 1.1498 (February 22).

On the flip side, key contention emerges at the 200-day SMA at 1.0742, which reinforces the weekly low at 1.0732 (March 27) and precedes the transitory 55-day and 100-day SMAs at 1.0664 and 1.0555, respectively.

Of note, however, is that the pair navigates in the overbought zone, which could spark some near-term technical correction.

EUR/USD daily chart


Disclaimer: For information purposes only. Past performance is not indicative of future results.
placeholder
A Crash After a Surge: Why Silver Lost 40% in a Week?TradingKey - Spot Silver ( XAGUSD) prices have continued to decline; on Thursday, silver plummeted as much as 20% to break below $71 per ounce, and on Friday the sell-off intensified as prices fell fu
Author  TradingKey
Yesterday 10: 23
TradingKey - Spot Silver ( XAGUSD) prices have continued to decline; on Thursday, silver plummeted as much as 20% to break below $71 per ounce, and on Friday the sell-off intensified as prices fell fu
placeholder
Bitcoin is trading around $63,000, down nearly 40% from its peak near $126,000Wall Street desks are no longer talking about upside dreams. The talk right now is how far Bitcoin charts could fall if selling keeps piling up. According to data from TradingView, Bitcoin’s price now sits at a shocking $63,500, after falling from $70,000 just this morning, losing $13,000 in 6 days, and staying far below […]
Author  Cryptopolitan
Yesterday 09: 03
Wall Street desks are no longer talking about upside dreams. The talk right now is how far Bitcoin charts could fall if selling keeps piling up. According to data from TradingView, Bitcoin’s price now sits at a shocking $63,500, after falling from $70,000 just this morning, losing $13,000 in 6 days, and staying far below […]
placeholder
WTI declines below $63.00 as US-Iran talks loom West Texas Intermediate (WTI), the US crude oil benchmark, is trading around $62.85 during the Asian trading hours on Friday. The WTI price declines after the United States (US) and Iran agreed to hold talks in Oman on Friday. 
Author  FXStreet
Yesterday 03: 10
West Texas Intermediate (WTI), the US crude oil benchmark, is trading around $62.85 during the Asian trading hours on Friday. The WTI price declines after the United States (US) and Iran agreed to hold talks in Oman on Friday. 
placeholder
Bitcoin Surrenders $65,000 as Analysts Warn of ‘Structural’ Market BreakBitcoin plunges 11% to break $65k as analysts term the crash "structural," citing a $1 trillion market wipeout and $2.09 billion in daily liquidations.
Author  Mitrade
Yesterday 01: 03
Bitcoin plunges 11% to break $65k as analysts term the crash "structural," citing a $1 trillion market wipeout and $2.09 billion in daily liquidations.
placeholder
Bitcoin Drops to $70,000. U.S. Government Refuses to Bail Out Market, End of Bull Market or Golden Pit? The U.S. government refuses to bail out Bitcoin, and with Fed rate cuts nowhere in sight, a continued downward trend to test for a bottom is likely after a brief rebound.During the mid-da
Author  TradingKey
Feb 05, Thu
The U.S. government refuses to bail out Bitcoin, and with Fed rate cuts nowhere in sight, a continued downward trend to test for a bottom is likely after a brief rebound.During the mid-da
Related Instrument
goTop
quote