


MANTRA Price Forecast: OM launches MANTRA Ecosystem Fund to boost RWA innovation and growth
- MANTRA price hovers around $6.24 on Wednesday after rallying almost 9% so far this week.
- MANTRA chain launched the MEF with over $108 million to drive innovation and growth in RWA tokenization.
- The technical outlook and on-chain metrics favor a rally continuation and holders accumulating OM tokens.
MANTRA (OM) price hovers around $6.24 on Wednesday after rallying almost 9% so far this week. On Monday, the MANTRA chain launched the MANTRA Ecosystem Fund (MEF) with over $108 million to drive innovation and growth in Real-World Asset (RWA) tokenization. Despite weakness in the overall crypto market, the technical outlook and on-chain metrics show a continuation of the rally and holders accumulating OM tokens.
MANTRA chain launches the MANTRA Ecosystem Fund
The MANTRA chain announced on Monday that it has launched the MANTRA Ecosystem Fund with $108,888,888 to drive innovation in Real-World Asset tokenization. This announcement triggered a rally in OM tokens by almost 10% that day.
The fund aims to bridge traditional finance and Decentralized Finance (DeFi) by supporting global blockchain projects over four years. The fund collaborates with major partners like Laser Digital, Amber Group, and Brevan Howard Digital, leveraging their networks to identify and invest in high-potential startups.
“If you’re a founder, team or dev with an idea, who wants to bring more of the world onchain, let’s talk. The MEF welcomes projects at any stage of development, on any chain,” says MANTRA on its X post.
This announcement projects a bullish outlook for OM, signaling strong institutional support and confidence in MANTRA’s vision. Moreover, it also boosts RWA tokenization, which could attract more investors to OM tokens.
Diving into the on-chain metric shows holders accumulating OM tokens. According to Santiment’s Supply Distribution data, whales bought OM tokens during the recent price dip.
Santiment’s Supply Distribution metric shows that the whales holding OM tokens between 100,000 to 1 million increased from 29.34 million on Monday to 30.18 million on Wednesday.
Similarly, wallets holding 1 million to 10 million and 10 million to 100 million OM tokens surged from 258.55 to 273.81 million and 497.92 to 584.74 million in the same period.
This development shows that the whales’ wallets seized the opportunity and accumulated MANTRA at a discount during the recent price dip, bolstering investors’ confidence in OM.
 [09-1744176486817.18.13, 09 Apr, 2025].png)
OM Supply Distribution chart. Source: Santiment
OM Price Forecast: Bulls aiming for double-digit rally
MANTRA price retested and found support around its 100-day Exponential Moving Average (EMA) at $5.77 on Monday and rallied 9.44%. This level coincides with the daily support level at $5.79, making this a key support zone. At the time of writing on Wednesday, it hovers around the $6.24 level.
If OM continues its upward momentum, it could extend the rally to retest its March 27 high of $6.86. A successful close above this could extend an additional rally by 20% to test its March 2 high of $8.23.
The Relative Strength Index (RSI) on the daily chart reads 46, approaching its neutral level of 50, indicating fading bearish momentum. The RSI must move above its neutral level of 50 for the bullish momentum to be sustained. Moreover, the MACD indicator is also about to flip a bullish crossover on the daily chart. If it flips a bullish crossover, it will give buy signals and indicate an upward trend.
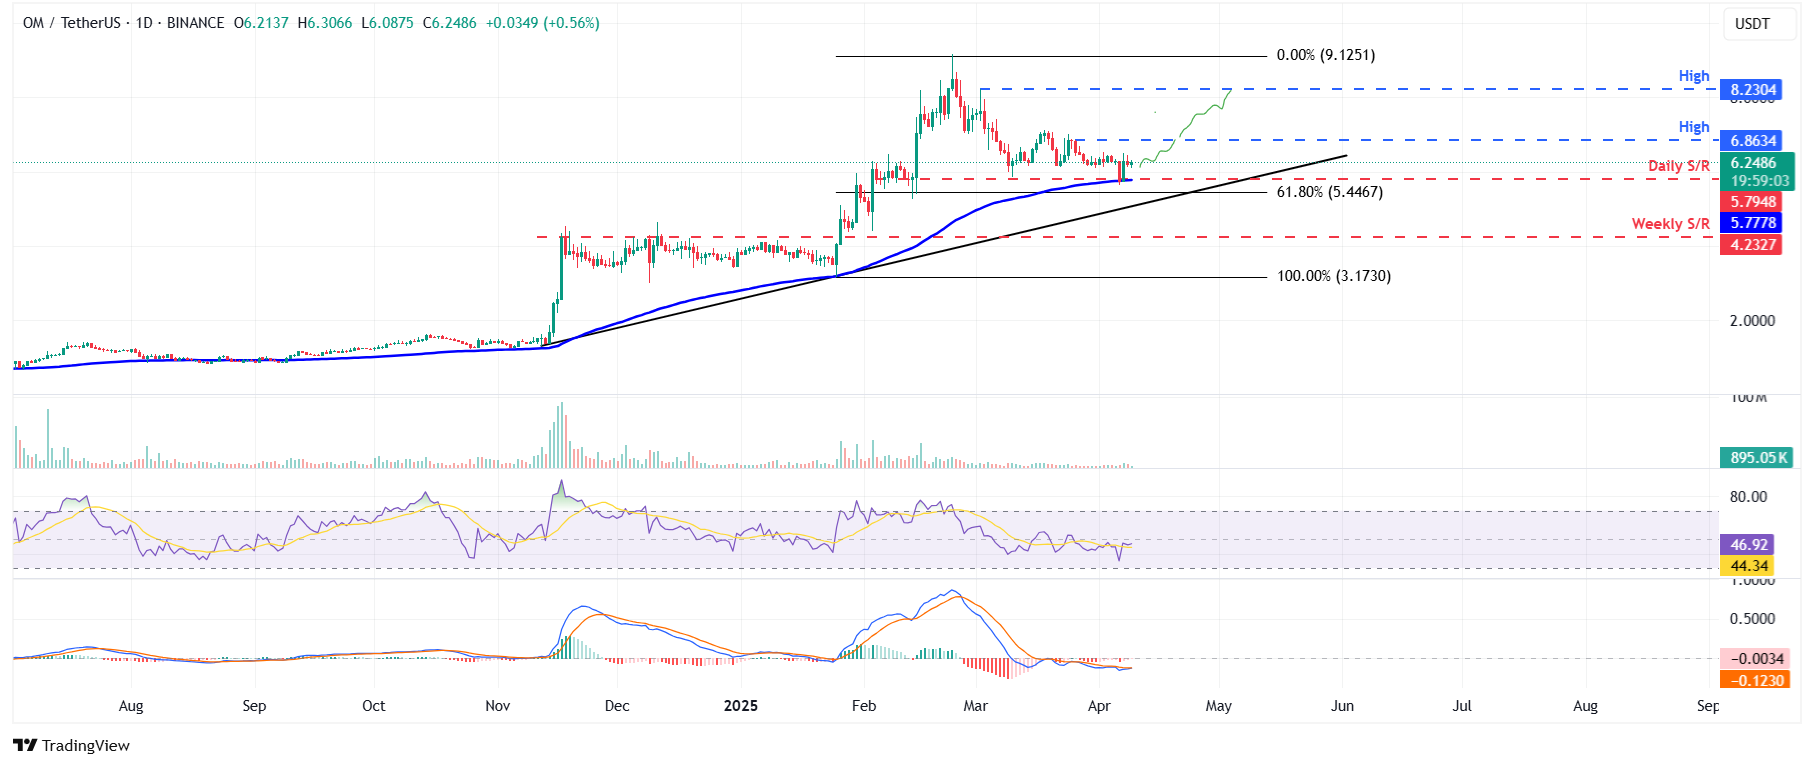
OM/USDT daily chart
However, if OM fails to find support around its 100-day EMA and closes below it, it could extend the decline to test its next support level at $5.44, its 61.8% Fibonacci retracement level (drawn from the January 25 low of $3.17 to February 23 high of $9.12).
Recommended Articles


