
Solana memecoins in red: Popcat and Dogwifhat shed $140M as TRUMP’s token tumbles 80% from all-time high
- Solana memecoin sector valuation hit $8.1 billion on Tuesday tumbling 24.5%, double the 12% average crypto market losses.
- Popcat and Dogewifhat posted 25% and 21% losses respectively, shedding $140 million in combined 24-hour valuation losses.
- Trump’s token valuation dropped to $2.5 billion, down 80% from its $12.8 billion all-time high, per Tradingview data.
Solana memecoin sector valuation declined by $2 billion in 24 hours to hit $8.1 billion in early Asian trading on Tuesday.
Technical indicators highlight key levels to watch as Popcat, Dogwihat and Trump emerge top losers.
Solana memecoins sector valuation drops below $10 billion amid double-speed sell-offs
The Solana (SOL) ecosystem has dominated crypto media headlines in recent weeks for mixed reasons.
On the positive side, Trump's inclusion of SOL in crypto strategic reserves on Sunday, after CME Group's decision to list SOL futures ETF on the world's largest institutional trading platform, both improved market sentiment last week.
However, Solana’s gains were due FXT estates' 11.2 billion SOL payouts to creditors began to flood market supply from the March 1 scheduled date.
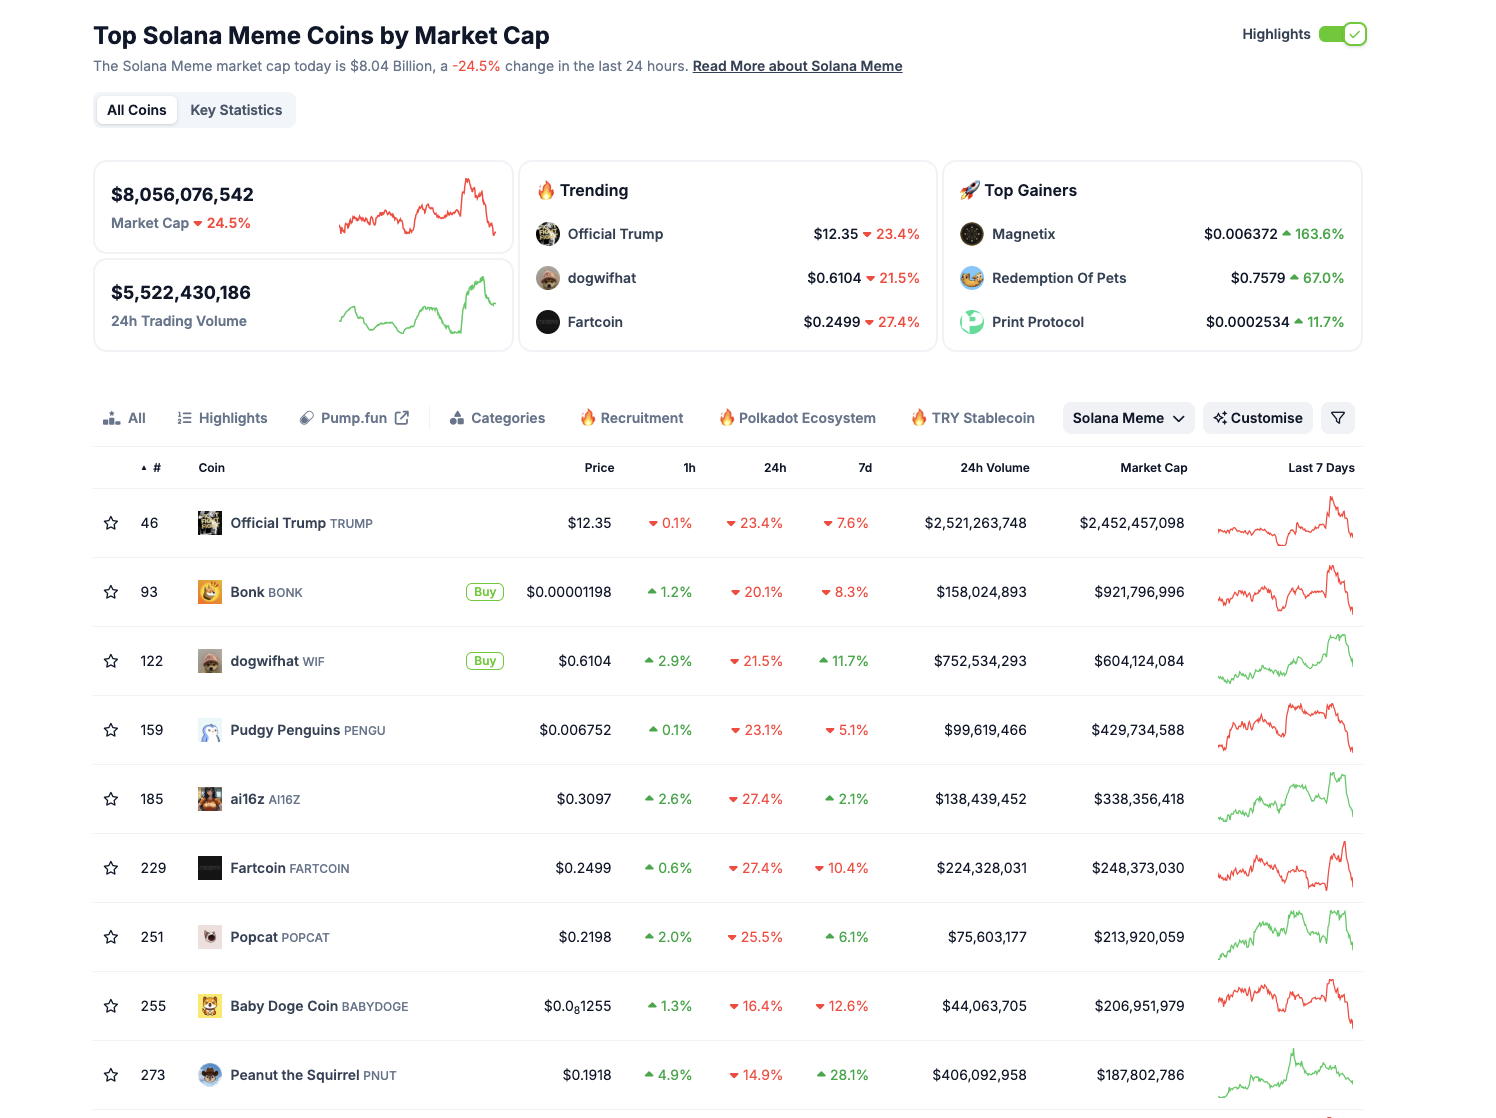
Solana memecoins sector performance | Coingecko, March 4, 2025
While the native SOL token price decline of 20% in the last 24 hours confirms an overwhelming negative, the bearish impact reverberated across the Solana ecosystem, particularly memecoins.
When news of Trump’s confirming tarrifs on Canada and Mexico broke on Tuesday, the Solana memecoin sector valuation hit $8.1 billion in 24 hours tumbling 24.5%, double the 12% average crypto market losses on the day.
Will Solana memecoins recover in March 2025 as Trump’s tariff woes trigger 24.5% losses?
Popcat, Dogwifhat and TRUMP all of the top 10 ranked Solana meme tokens had posted excess of 10% losses, at the time of writing, confirming impact of the cascading market sell-offs.
Technical analysis indicators highlight key levels POPCAT, WIF and TRUMP traders could watch as the Solana memecoin ecosystem makes a false start to March 2025.
POPCAT Price Forecast: Short traders eyeing $0.18 reverse if bulls fail to reclaim $0.25
Market momentum leans bearish, with POPCAT trading at $0.22 after breaking below the midline of its Keltner Channel at $0.25.
The POPCAT price rejection from this level has left the token vulnerable to further downside, with the lower Keltner band at $0.18 now the immediate support. If sellers maintain control, a breach below $0.18 could accelerate losses toward $0.15.
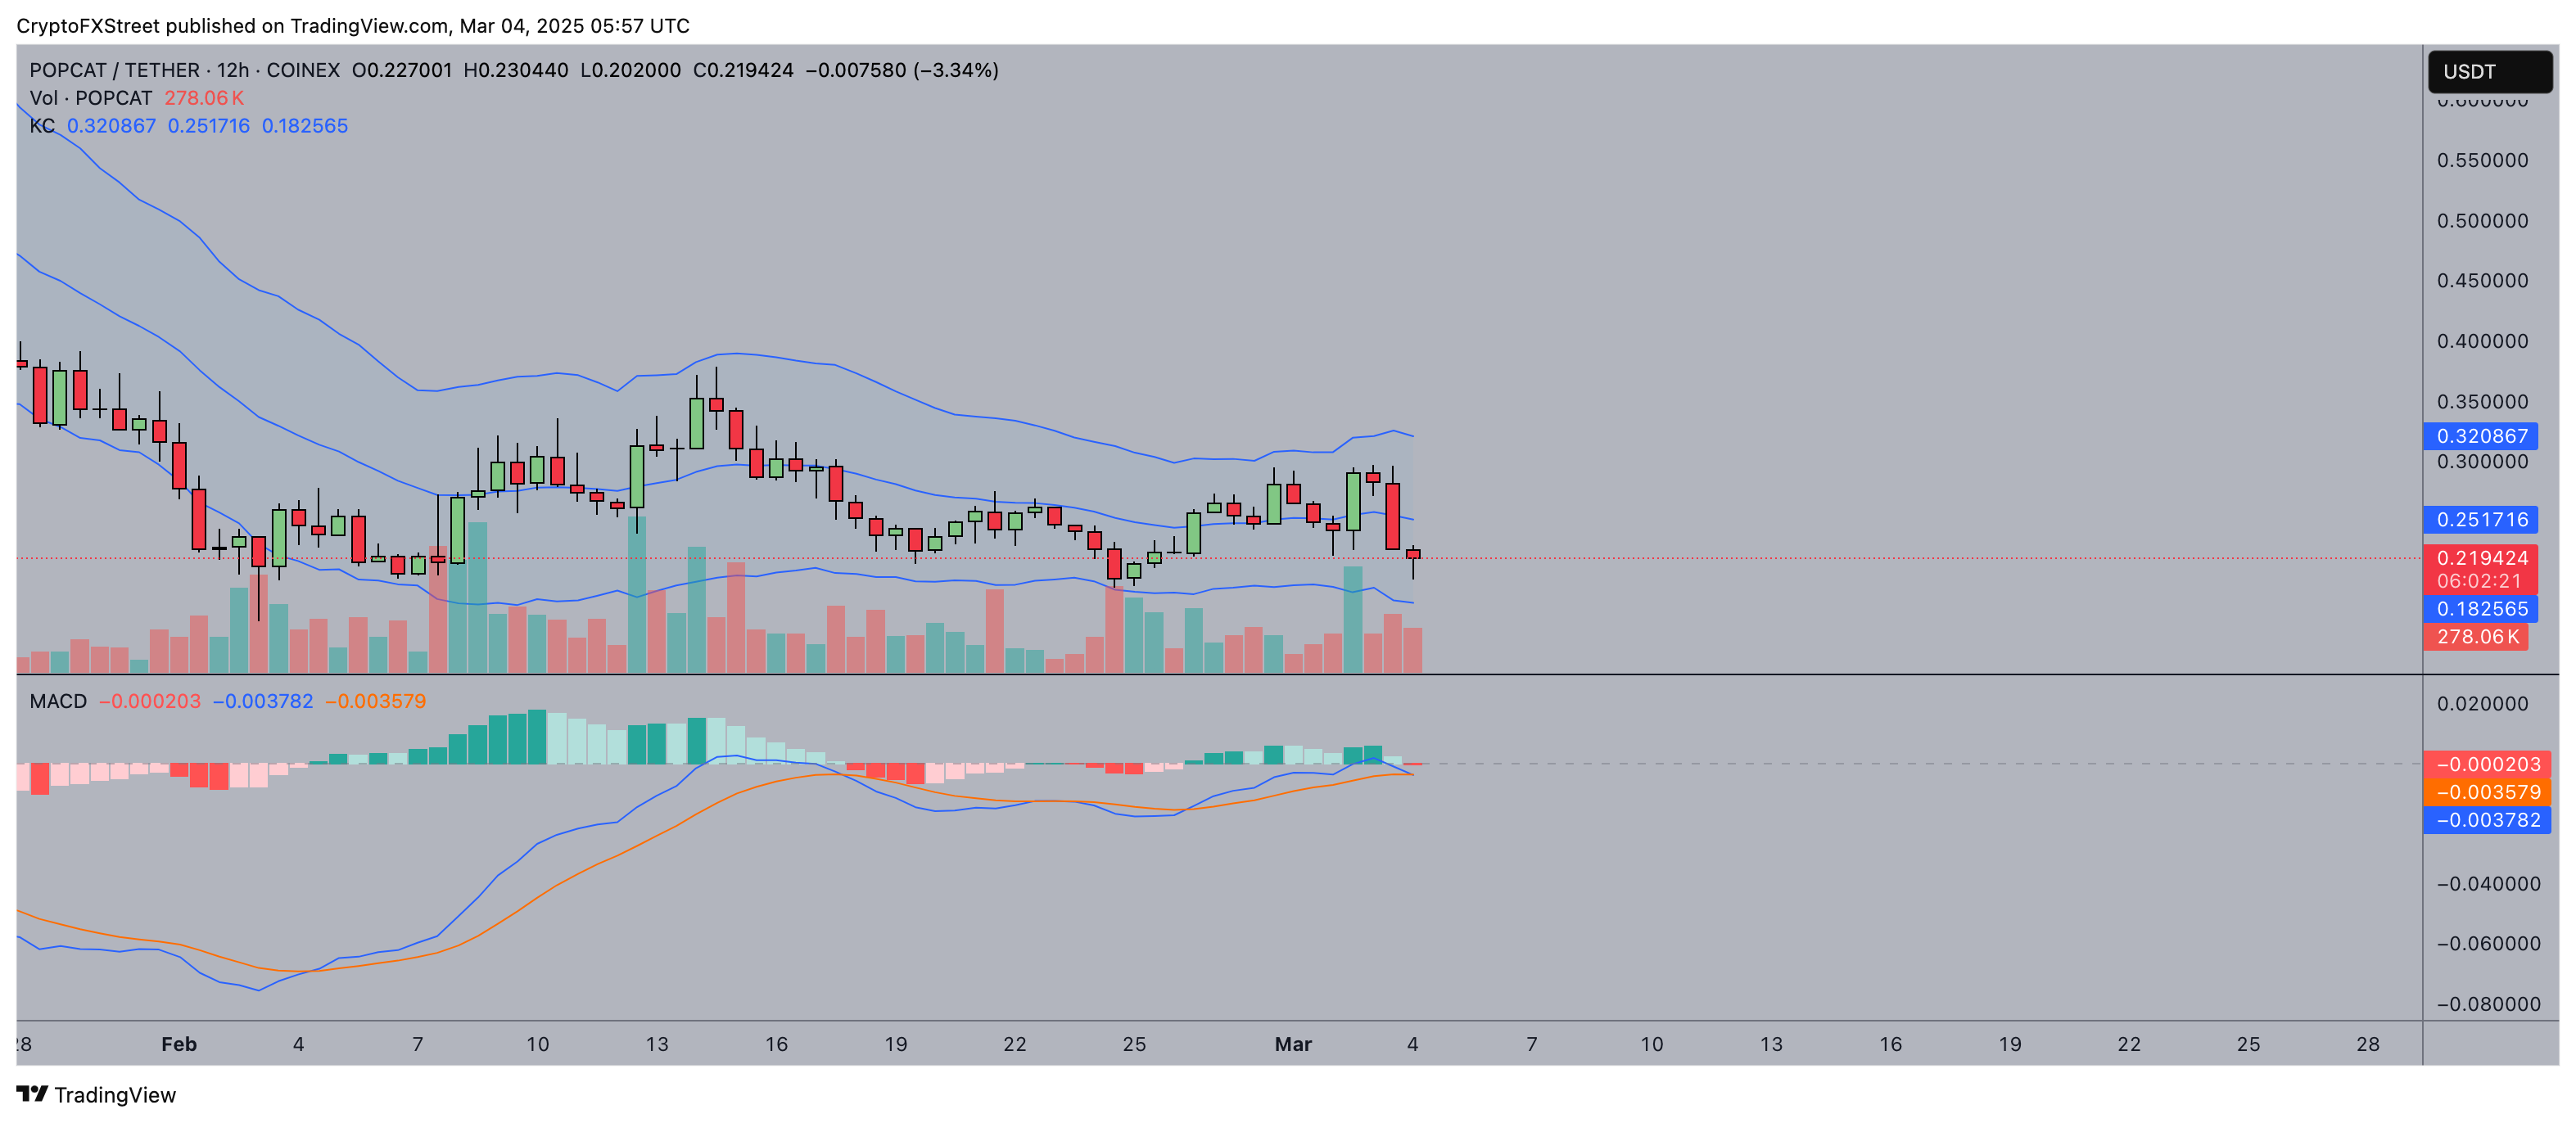 POPCAT Price Forecast
The MACD histogram has flipped into negative territory, with the MACD line crossing below its signal line.
This bearish crossover indicates that downward momentum is building, reinforcing the probability of a continued decline.
However, if bulls can stabilize the price above $0.21 and initiate a relief rally, a move back toward $0.25 remains possible.
Volume data shows a surge in sell-side pressure, confirming the bearish bias.
For bulls to regain control, they must drive POPCAT back above $0.25 to negate the current downward trajectory.
A decisive close above this level could shift momentum back in favor of buyers, potentially pushing the price toward $0.32.
Until then, the risk of a slide to $0.18 remains the dominant scenario.
Dogwifhat Price Forecast: Bears targeting $0.50 breakdown as bearish momentum builds
Dogwifhat price leans bearish, currently trading at $0.61 after rejecting from the Donchian Channel midline at $0.650.
The downward pressure is reinforced by the Parabolic SAR trend indicator, which remains positioned above WIF’s current price, signaling a continued bearish bias.
If sellers maintain control, a breakdown below the lower Donchian band at $0.52 could accelerate losses toward the psychological $0.50 level.
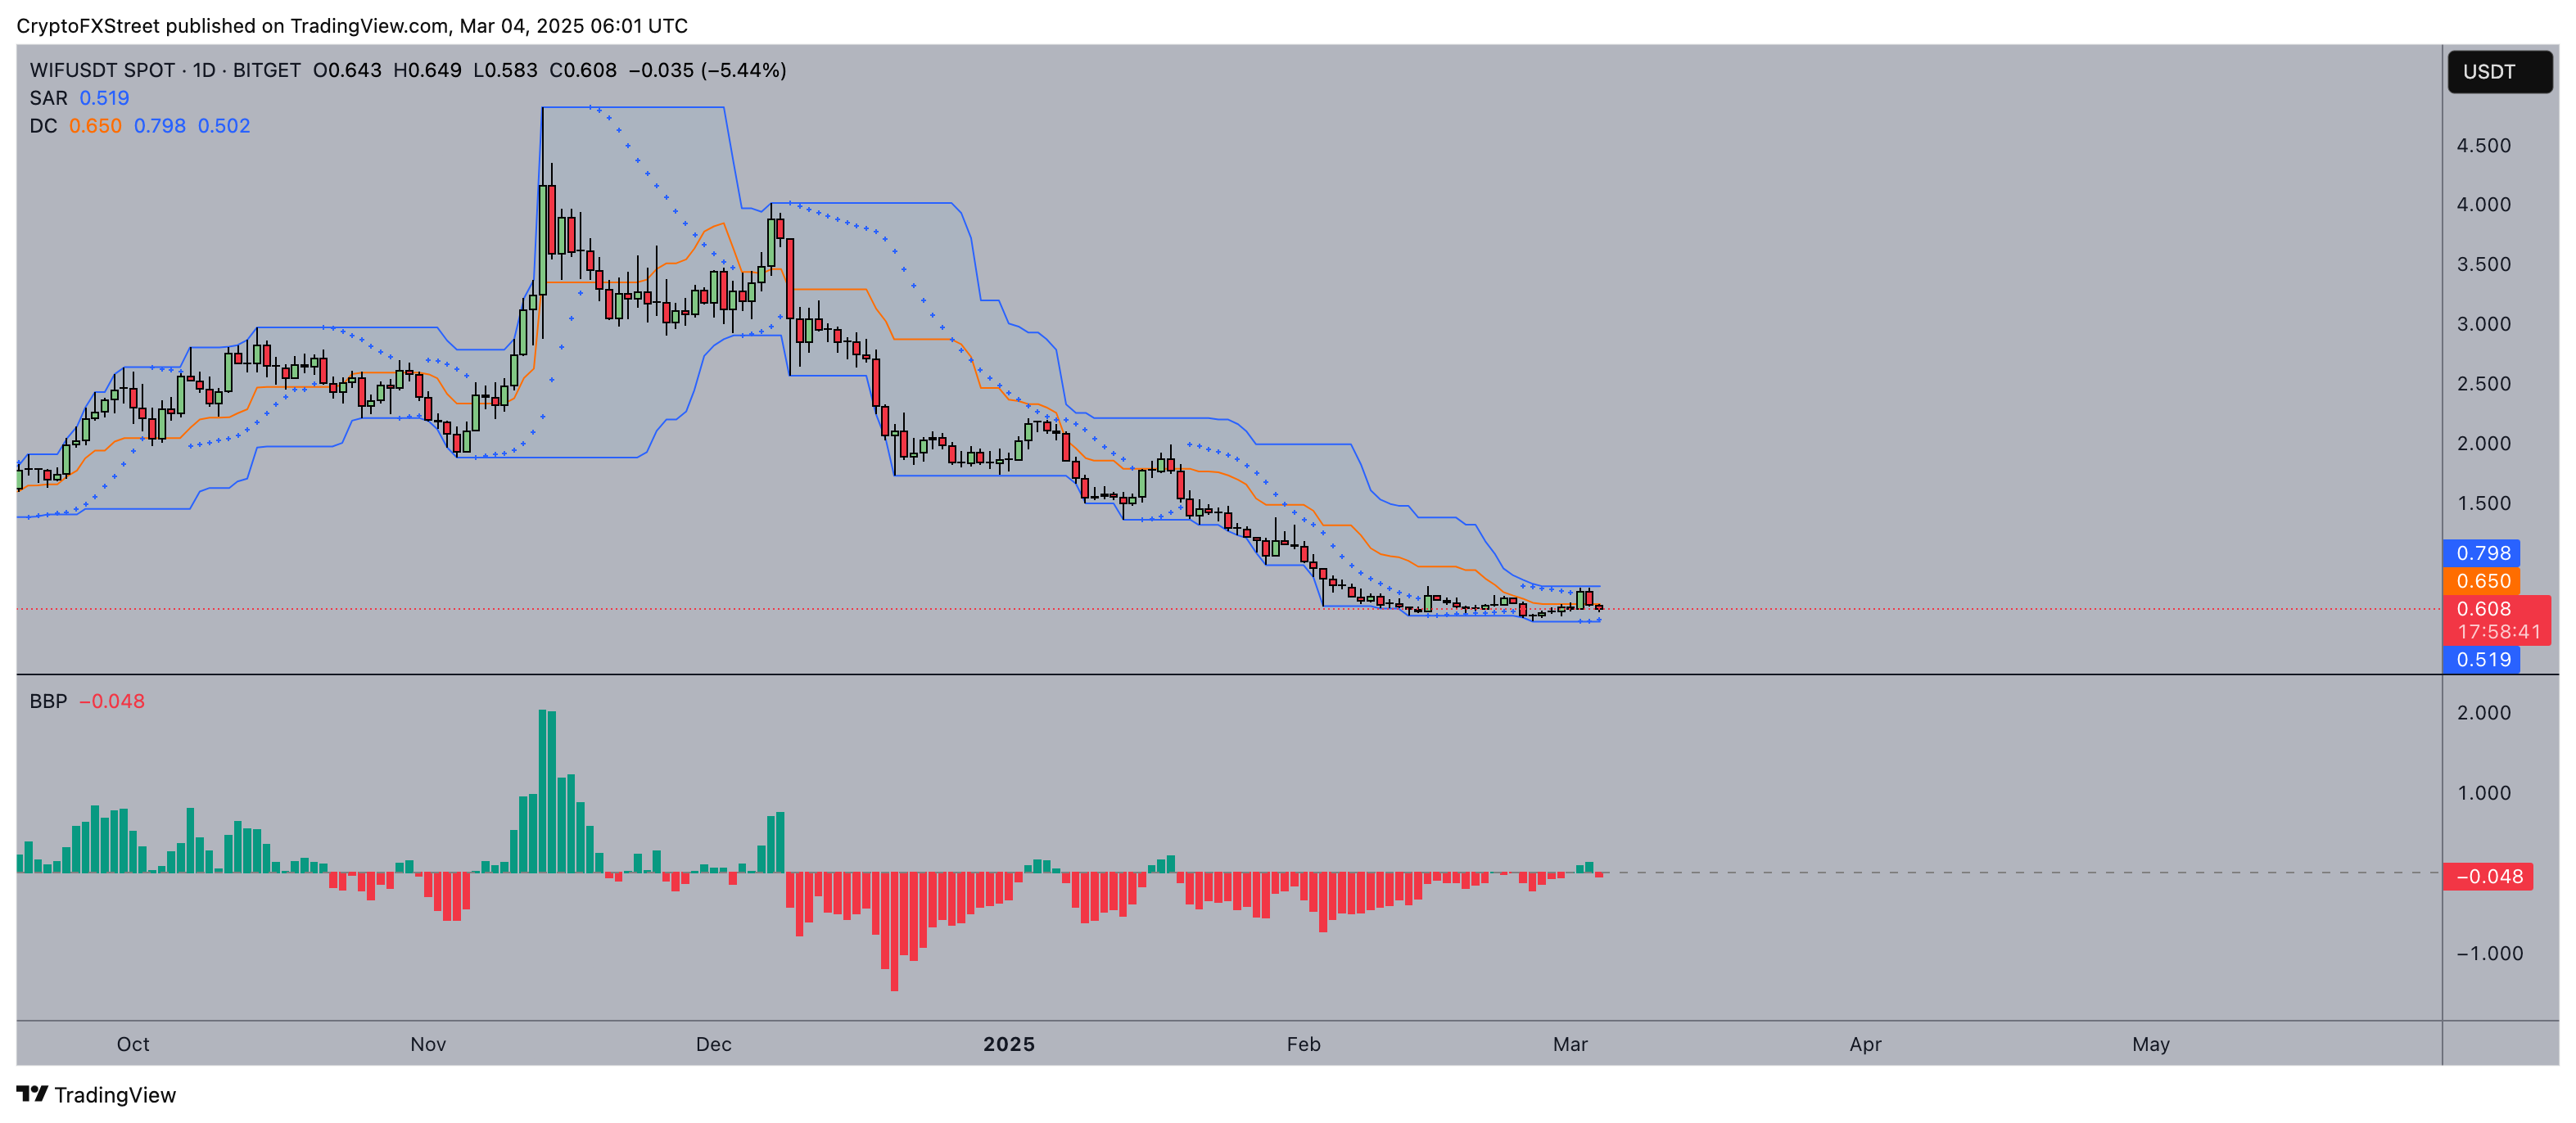 Dogwifhat Price Forecast | WIF
The Bull-Bear Power (BBP) indicator confirms weakening bullish momentum, printing a negative reading of -0.047.
This suggests that sellers remain dominant, making a bearish continuation more likely unless bulls reclaim key levels.
A decisive daily close above $0.65 would be necessary to negate the current downtrend and open a path toward $0.80.
However, without strong buying pressure, the likelihood of a deeper pullback remains high.
As volume remains low and sellers dictate price action, WIF risks further downside unless a strong bid emerges to reclaim resistance levels.
If bearish sentiment prevails, a move toward $0.50 remains the dominant scenario in the short term.
TRUMP Price Forecast: $10 breakdown ahead if with valuation down 80% from all-time high
Trump’s token valuation has plunged to $2.5 billion, an 80% decline from its $12.8 billion all-time high, according to TradingView data.
TRUMP price is leaning bearish, currently trading at $12.40 after breaking below the middle Bollinger Band at $13.84.
The rejection from the upper band at $16.89 signals increased downside risk, with the lower band at $10.80 now a potential support.
A sustained breakdown below this level could send TRUMP toward the psychological $10 level, where buyers may attempt to defend.
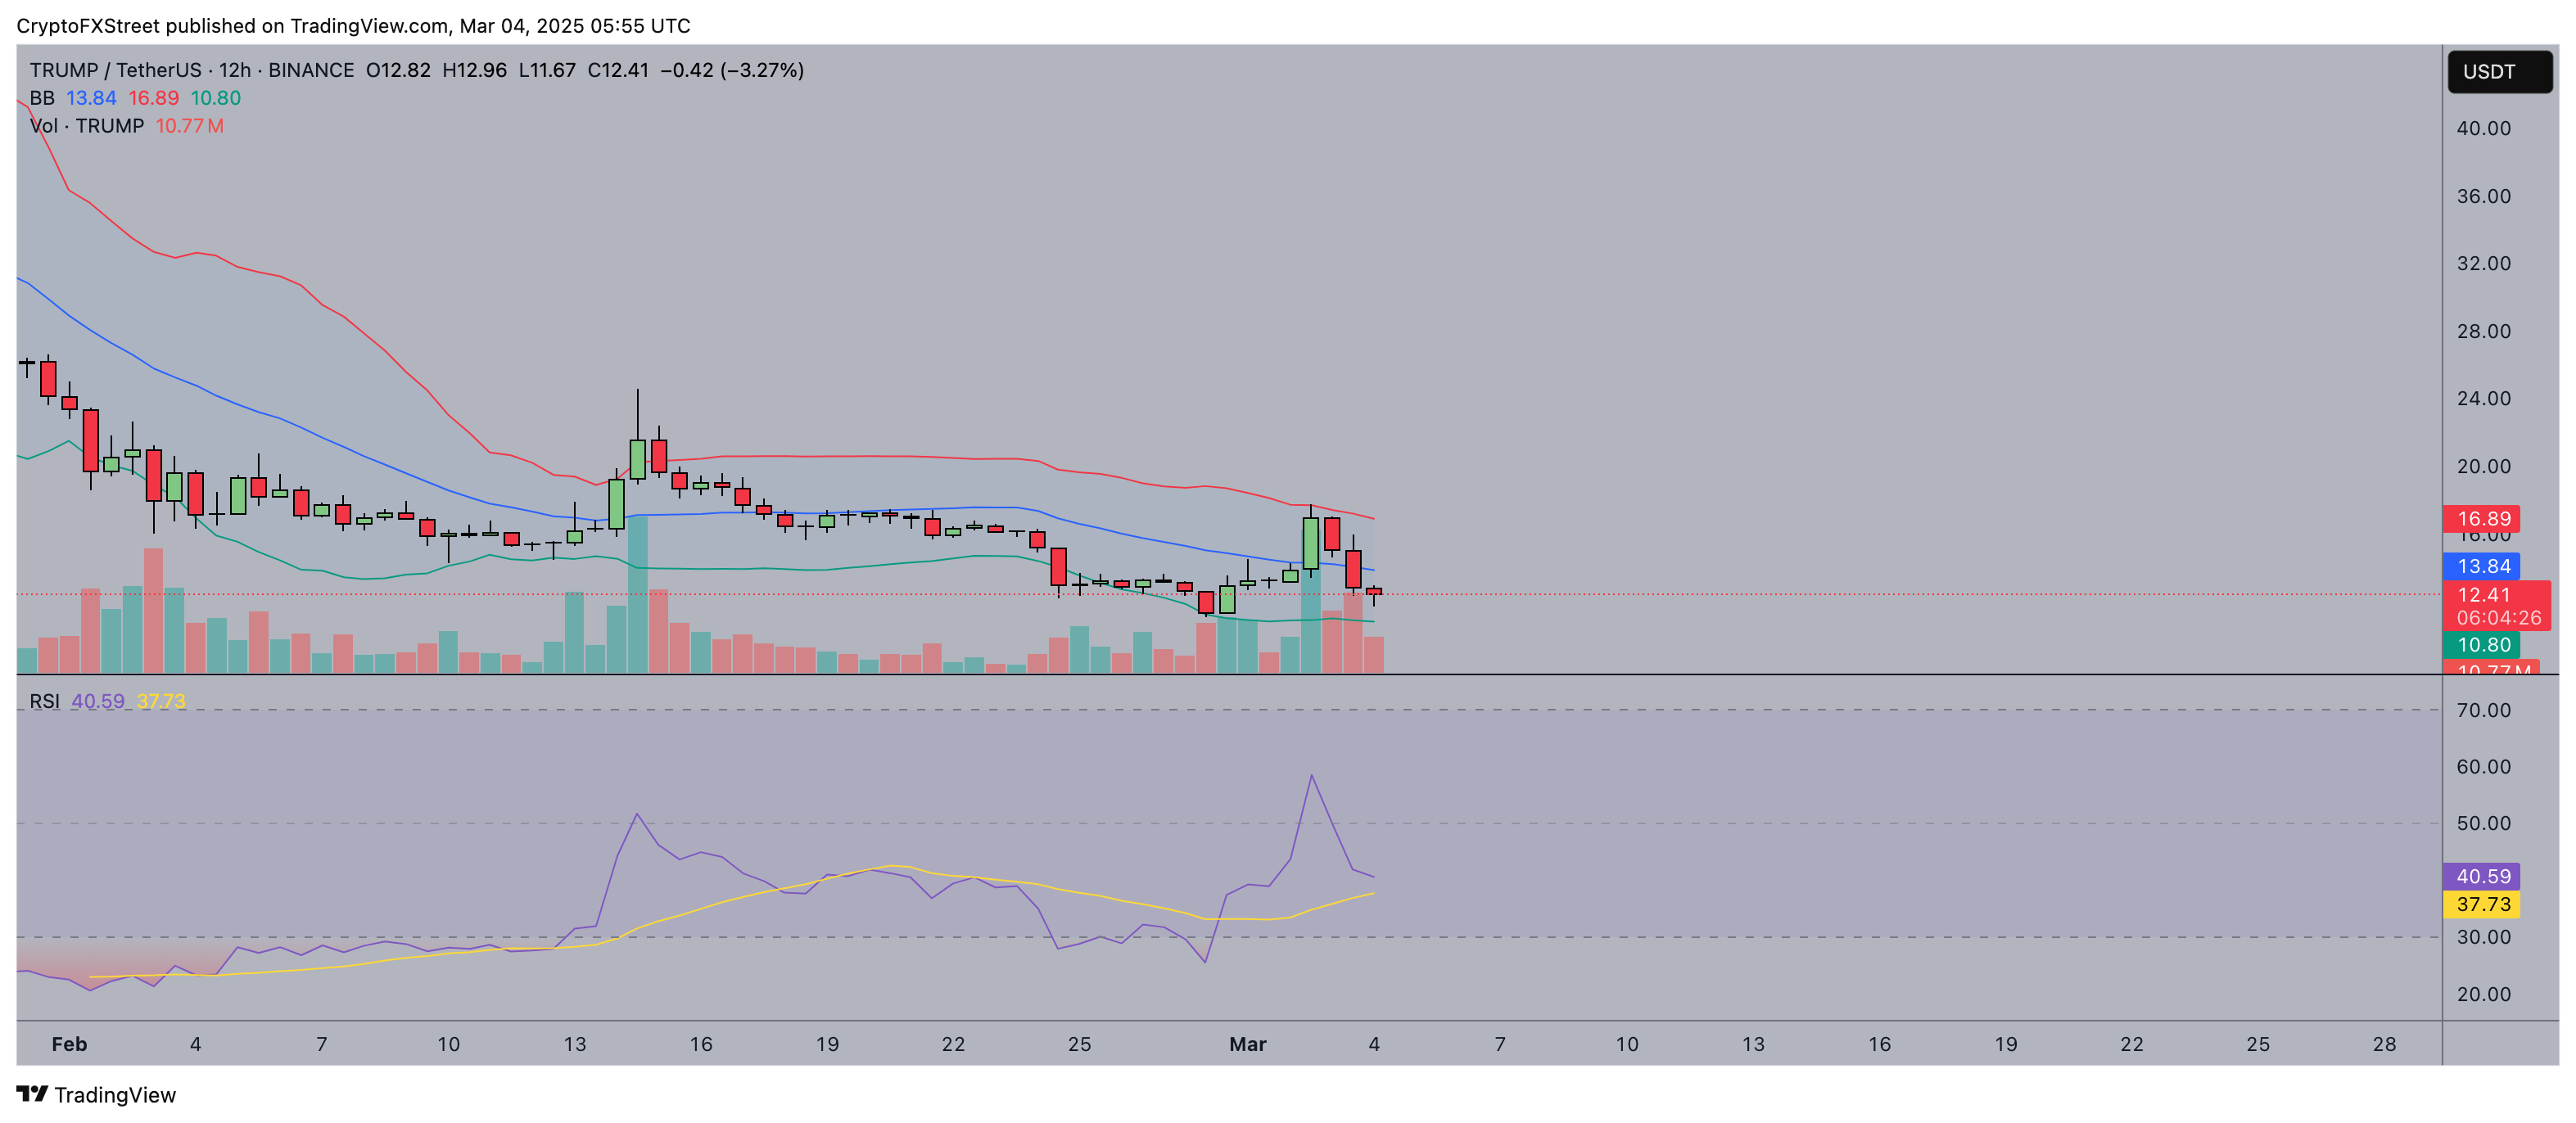
TRUMP Price Forecast
The 12-hour RSI sits at 40.56, trending downward after failing to reclaim the neutral 50 mark.
This indicates weakening bullish momentum, while the RSI moving average at 37.72 suggests TRUMP could enter oversold territory if selling persists.
A bounce from these levels may see the price retest the middle Bollinger Band, but failure to reclaim it would reinforce bearish dominance.
If TRUMP price holds above $10.80 and RSI stabilizes, a relief rally toward $14 could emerge.
However, without stronger buying volume, the broader downtrend remains intact, leaving TRUMP vulnerable to further losses toward $10
Recommended Articles


