USD/CNH Price Analysis: Remains above 7.3500 near two-year highs

Source Fxstreet
  • USD/CNH could approach initial resistance at 7.3697, marking the highest level since October 2022.
  • The 14-day RSI remains below the 70 level, further supporting the sustained bullish bias.
  • The immediate support zone is seen around the nine-day EMA at the 7.3435 level.

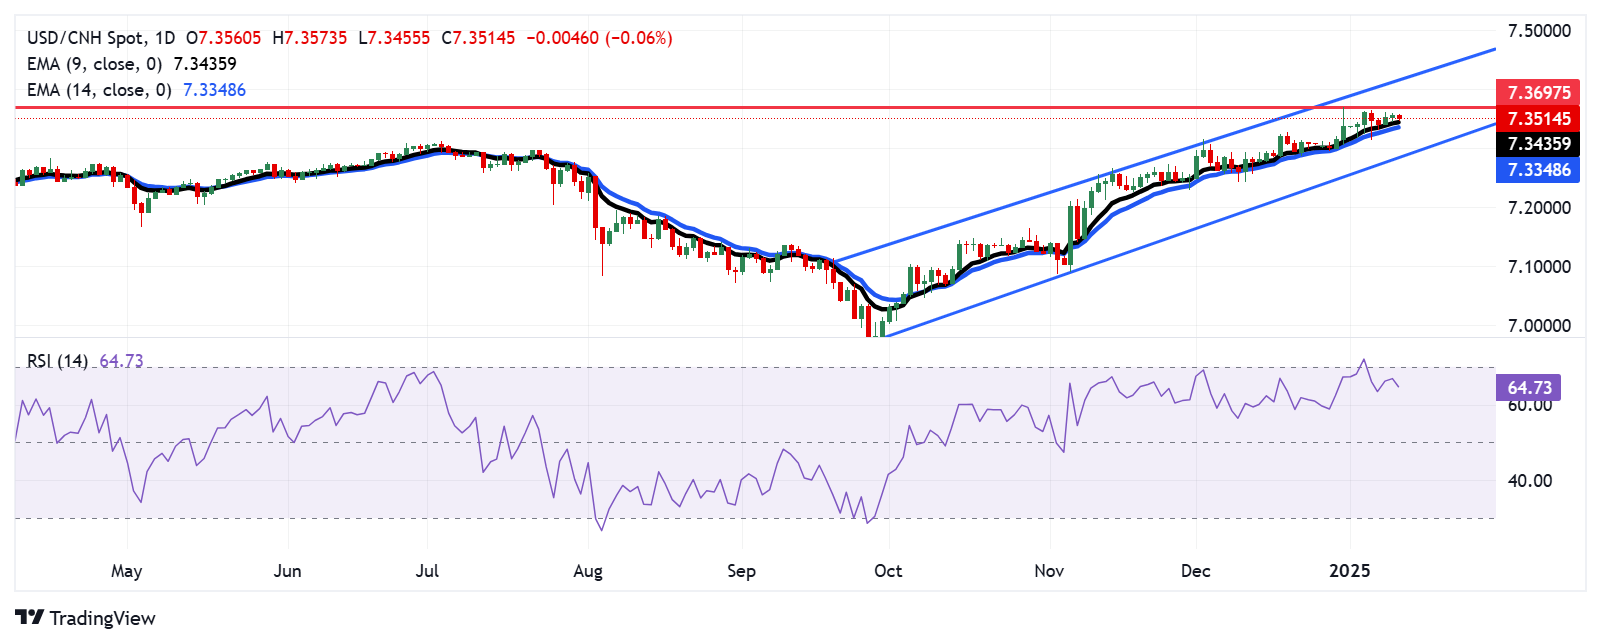
The USD/CNH pair retraces its two days of gains, trading around 7.3520 during the Asian hours on Friday. An analysis of the daily chart indicates that the price movement within the ascending channel pattern is intensifying, which points to a strengthening bullish trend.

The 14-day Relative Strength Index (RSI), a key momentum indicator, holds below the 70 level, reinforcing the ongoing bullish momentum. Moreover, the USD/CNH pair trades above both the nine-day and 14-day Exponential Moving Averages (EMAs), further suggesting robust short-term price momentum.

The USD/CNH pair could test primary resistance at 7.3697, the highest level since October 2022, reached on December 31. A break above this level could reinforce the bullish bias and support the pair to approach the upper boundary of the ascending channel at the 7.4150 level.

On the downside, the USD/CNH pair may initially test the nine-day Exponential Moving Average at the 7.3435 level, followed by the 14-day EMA at the 7.3348 level. A break below this level would weaken the short-term price momentum and lead the pair to navigate the area around the ascending channel’s lower boundary at the 7.2890 level.

USD/CNH: Daily Chart
 

Disclaimer: For information purposes only. Past performance is not indicative of future results.
placeholder
Why Did The S&P 500 And Nasdaq Composite Just Fall Over 1%?TradingKey - The year 2025 started off on a pretty solid footing for investors with the key indices in the US – the S&P 500 Index and the tech-focused Nasdaq Composite Index – both posting gains in the first few days of trading. That followed on from some huge double-digit gains for 2023 and 2024.
Author  TradingKey
Jan 08, Wed
TradingKey - The year 2025 started off on a pretty solid footing for investors with the key indices in the US – the S&P 500 Index and the tech-focused Nasdaq Composite Index – both posting gains in the first few days of trading. That followed on from some huge double-digit gains for 2023 and 2024.
placeholder
XRP Price Eyes Bullish Flag Breakout That Could Put 50% Gains On The BoardDespite recent declines and volatility, a crypto analyst has declared that the XRP price is on the cusp of breaking out of a bullish flag pattern. According to the analyst, a successful breakout of
Author  NewsBTC
Yesterday 01: 22
Despite recent declines and volatility, a crypto analyst has declared that the XRP price is on the cusp of breaking out of a bullish flag pattern. According to the analyst, a successful breakout of
placeholder
Japanese Yen recovers from multi-month low against USD on stronger wage growth dataThe Japanese Yen (JPY) ticks higher against its American counterpart after government data showed this Thursday that base pay in Japan grew at the fastest pace in more than three decades.
Author  FXStreet
Yesterday 03: 49
The Japanese Yen (JPY) ticks higher against its American counterpart after government data showed this Thursday that base pay in Japan grew at the fastest pace in more than three decades.
placeholder
Ripple's XRP plunges over 4% following funding rates declineRipple's XRP declined 4% on Friday following a decline in its funding rates.
Author  FXStreet
10 hours ago
Ripple's XRP declined 4% on Friday following a decline in its funding rates.
placeholder
Top 3 Price Prediction Bitcoin, Ethereum, Ripple: All hints for a continuation of the correctionBitcoin (BTC) retests its key support level of $92,493; a firm close below it could continue its ongoing correction.
Author  FXStreet
5 hours ago
Bitcoin (BTC) retests its key support level of $92,493; a firm close below it could continue its ongoing correction.
goTop
quote