
Dow Jones Industrial Average rises then falls as headline turmoil resumes
- The Dow Jones recovered 200 points on Friday but still remains down on the week.
- Equities broadly recovered after US PCE inflation came in as expected.
- Coming up next week: maybe, maybe not tariffs and another NFP print.
The Dow Jones Industrial Average (DJIA) recovered some lost ground on Friday, rebounding about 200 points to remain in contention with the 43,500 level before giving up and falling back to the day’s opening bids. Despite Friday’s bullish attempt, the major equity index remains down from Monday’s opening prices. US President Donald Trump got in a row with Ukrainian President Volodymyr Zelenskyy after the Ukrainian leader declined to sign Donald Trump’s defense agreement without asking questions or seeking expanded clarification on the contents of President Trump’s much-desired “rare earths deal”.
Read more: US President Trump, Ukrainian President Zelenskyy exchange barbs over defense deal
Despite a recent uptick in headline inflation figures, US Personal Consumption Expenditure Price Index (PCEPI) inflation data still came in broadly as expected, helping to soothe some frayed investor nerves. January’s core PCE Price Index eased to 2.6% YoY from a revised 2.9% YoY, matching median market forecasts. Despite the overall upbeat tone of Friday’s inflation print, market exuberance is unlikely to stretch too far: US inflation factors remain volatile in the face of inconsistent trade policy from the White House, and core metrics continue to run hotter than the Federal Reserve’s (Fed) ideal target of 2%.
A recent uptick in hostile trade language from US President Donald Trump has stepped up investor concerns this week. Markets have generally gotten used to brushing off Donald Trump’s trade tariff bluster after several walkbacks on his own arbitrary timelines for imposing widespread tariffs on most of the US’ closest trading partners. However, President Trump revamped his recent tariff threats, pivoting on his latest delay and declaring that a 25% tariff package on both Canada and Mexico would be coming into effect on March 4.
Adding to market pressures next week, a fresh iteration of US Nonfarm Payrolls (NFP) data looms ahead next Friday. Recent economic data has tilted toward the downside, making investors increasingly concerned about a potential slowdown. Recent jobless figures also accelerated, raising concerns that the US labor market may be showing cracks. Next week’s NFP print will carry additional weight, outside of the usual heavy-hitter it tends to be.
Dow Jones news
The Dow Jones is trading roughly half-and-half on Friday, with winners and losers hung across the middle. 3M (MMM) gained 1.7%, climbing to $153 per share, while IBM (IBM) fell 2%, slipping below $250 per share.
Dow Jones price forecast
The Dow Jones continues to churn lower into bear country, trading on the south side of the 50-day Exponential Moving Average (EMA) near 43,840. The major equity index is still holding above the 200-day EMA at the 42,000 handle, but that particular bull run is growing long in the tooth with the Dow entirely outrunning its own 200-day EMA for over two years. Bullish momentum has certainly faded, but time is running out for sellers as technical oscillators grind into oversold territory, and the DJIA is barely down 4% from its last swing high near 45,000.
Dow Jones daily chart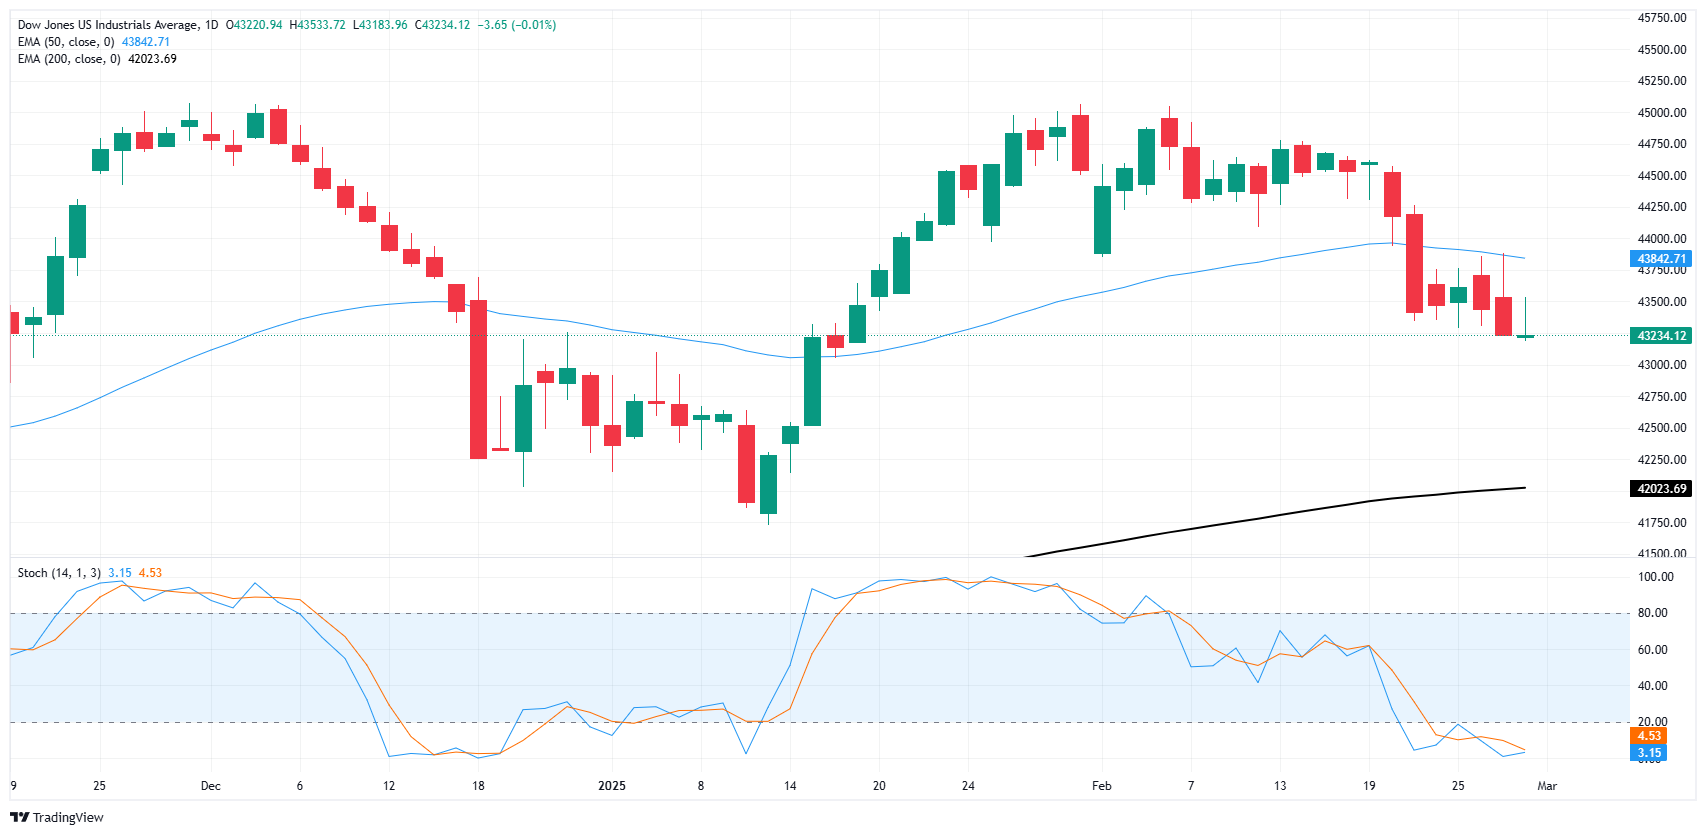
Dow Jones FAQs
The Dow Jones Industrial Average, one of the oldest stock market indices in the world, is compiled of the 30 most traded stocks in the US. The index is price-weighted rather than weighted by capitalization. It is calculated by summing the prices of the constituent stocks and dividing them by a factor, currently 0.152. The index was founded by Charles Dow, who also founded the Wall Street Journal. In later years it has been criticized for not being broadly representative enough because it only tracks 30 conglomerates, unlike broader indices such as the S&P 500.
Many different factors drive the Dow Jones Industrial Average (DJIA). The aggregate performance of the component companies revealed in quarterly company earnings reports is the main one. US and global macroeconomic data also contributes as it impacts on investor sentiment. The level of interest rates, set by the Federal Reserve (Fed), also influences the DJIA as it affects the cost of credit, on which many corporations are heavily reliant. Therefore, inflation can be a major driver as well as other metrics which impact the Fed decisions.
Dow Theory is a method for identifying the primary trend of the stock market developed by Charles Dow. A key step is to compare the direction of the Dow Jones Industrial Average (DJIA) and the Dow Jones Transportation Average (DJTA) and only follow trends where both are moving in the same direction. Volume is a confirmatory criteria. The theory uses elements of peak and trough analysis. Dow’s theory posits three trend phases: accumulation, when smart money starts buying or selling; public participation, when the wider public joins in; and distribution, when the smart money exits.
There are a number of ways to trade the DJIA. One is to use ETFs which allow investors to trade the DJIA as a single security, rather than having to buy shares in all 30 constituent companies. A leading example is the SPDR Dow Jones Industrial Average ETF (DIA). DJIA futures contracts enable traders to speculate on the future value of the index and Options provide the right, but not the obligation, to buy or sell the index at a predetermined price in the future. Mutual funds enable investors to buy a share of a diversified portfolio of DJIA stocks thus providing exposure to the overall index.
Recommended Articles


