
Dow Jones Industrial Average turns tepid on Thursday
- The Dow Jones is holding near key moving averages on Thursday.
- Markets were largely unimpressed with US Retail Sales figures.
- Investors continue to hinge their exposure on Fed rate cut expectations.
The Dow Jones Industrial Average (DJIA) struck a middling tone on Thursday, churning around the 43,200 handle. Price action is hung up on the 50-day Exponential Moving Average (EMA), and investors await any sign of data that could signal a faster pace of rate cuts from the Federal Reserve (Fed).
Retail Sales figures moderated in December, easing back to 0.4% MoM in the headline figure. Markets expected a tick down to 0.6% from the previous month’s revised 0.8%. Core Retail Sales excluding automotive expenditures rose to 0.4% MoM from 0.2%, meeting median analyst forecasts. The mixed figures failed to spark significant changes in investor sentiment in either direction, and bidding action is muddling through a largely non-starter of a day for equities.
Despite overall middling action in equity markets, things are moving behind the scenes as traders jostle for position based on Fed rate cut expectations. Treasuries pulled back sharply earlier this week, and according to the CME’s FedWatch Tool, rate markets are now pricing in slightly more than even odds of the Fed delivering another quarter-point rate cut on May 7, a step closer than the previous middle ground of June 18.
Dow Jones news
The Dow Jones is taking a bit of a breather after a three-day bull run that saw the major equity index recover nearly 4% after kicking off the trading week near its lowest bids since October. The majority of the Dow’s listed equities are testing into the green on Thursday, but concentrated losses in key stocks are hobbling the average’s overall performance.
UnitedHealth Group (UNH) tumbled 4.5%, falling below $520 per share after the major health sector player missed analyst revenue expectations, reporting fourth-quarter income of $100.8 billion dollars, growing by 6.8% YoY. Wall Street expected at least %101.6 billion in revenue in Q4.
Apple (AAPL) is also shedding weight on the day, falling 3% and declining to $230 per share after it was revealed the tech megagiant is losing market share in Asian consumer arenas as upstart competitors take advantage of localized government subsidies. Apple still remains the preeminent name to beat in the smartphone market, but it lost market share in mainland China for the first time since 2023 even as overall consumer demand in the region saw growth for the first time in two years.
Dow Jones price forecast
Investors continue to bolster the Dow Jones back into the high end, determined to keep price action bolstered north of the 50-day EMA near 43,000. The Dow is testing the waters near 43,200 as major price levels rotate to provide technical support through intraday chart action.
Despite a near-term turnaround, bulls are showing some signs of exhaustion, and the Dow Jones remains down nearly 4% from record highs set back in November. DJIA is still running well north of its 200-day EMA which is climbing above 41,000, but a deepening pattern of swing lows may imply that the race could be coming to an end.
Dow Jones daily chart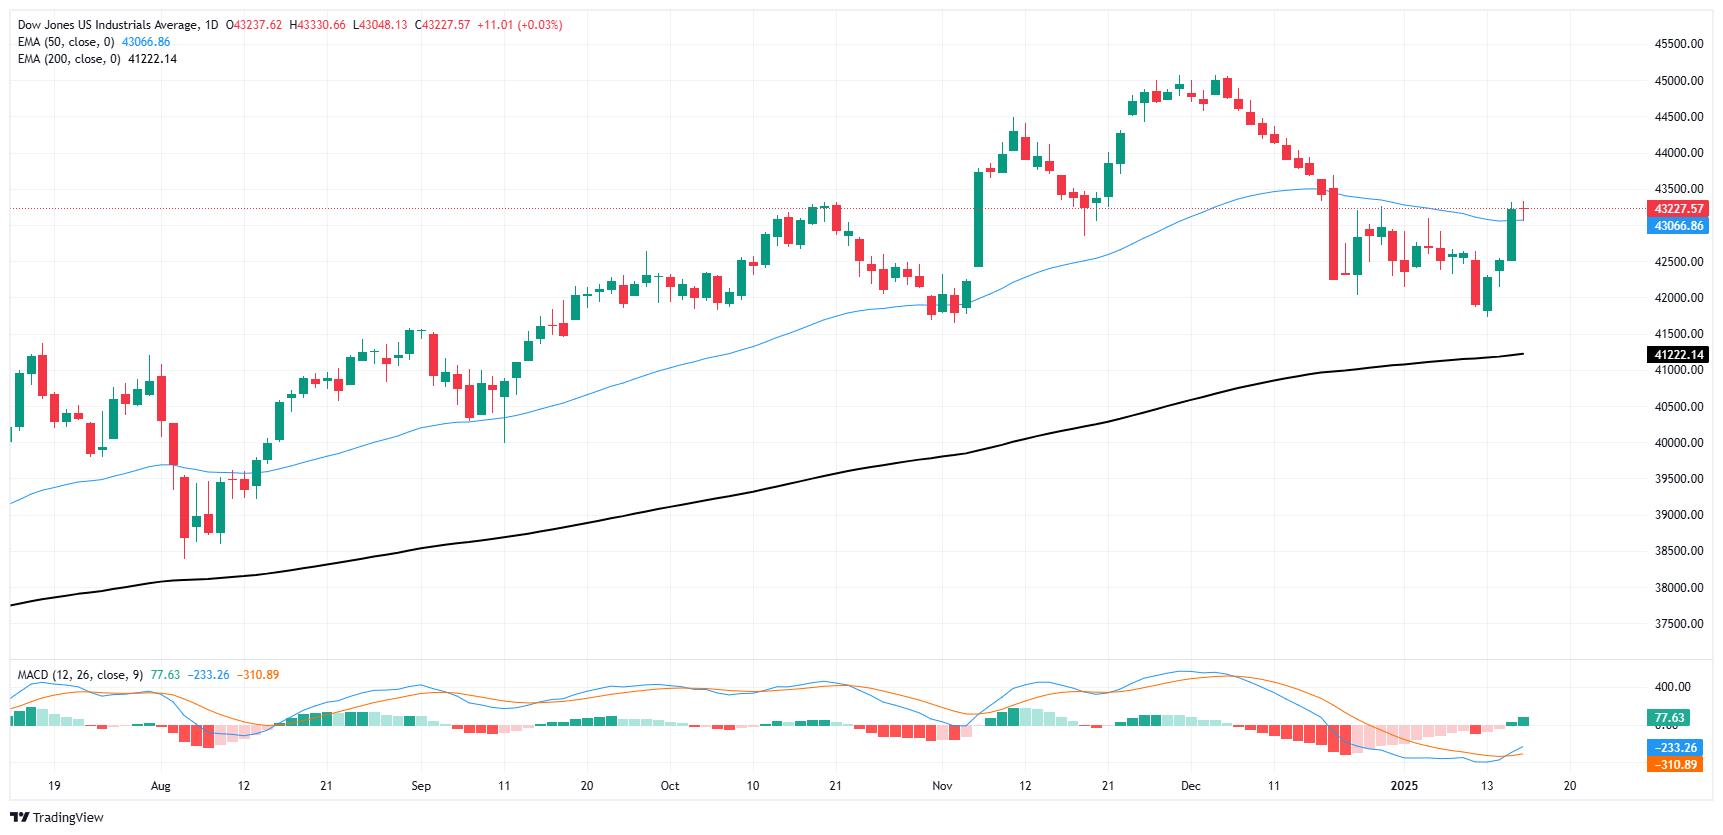
Dow Jones FAQs
The Dow Jones Industrial Average, one of the oldest stock market indices in the world, is compiled of the 30 most traded stocks in the US. The index is price-weighted rather than weighted by capitalization. It is calculated by summing the prices of the constituent stocks and dividing them by a factor, currently 0.152. The index was founded by Charles Dow, who also founded the Wall Street Journal. In later years it has been criticized for not being broadly representative enough because it only tracks 30 conglomerates, unlike broader indices such as the S&P 500.
Many different factors drive the Dow Jones Industrial Average (DJIA). The aggregate performance of the component companies revealed in quarterly company earnings reports is the main one. US and global macroeconomic data also contributes as it impacts on investor sentiment. The level of interest rates, set by the Federal Reserve (Fed), also influences the DJIA as it affects the cost of credit, on which many corporations are heavily reliant. Therefore, inflation can be a major driver as well as other metrics which impact the Fed decisions.
Dow Theory is a method for identifying the primary trend of the stock market developed by Charles Dow. A key step is to compare the direction of the Dow Jones Industrial Average (DJIA) and the Dow Jones Transportation Average (DJTA) and only follow trends where both are moving in the same direction. Volume is a confirmatory criteria. The theory uses elements of peak and trough analysis. Dow’s theory posits three trend phases: accumulation, when smart money starts buying or selling; public participation, when the wider public joins in; and distribution, when the smart money exits.
There are a number of ways to trade the DJIA. One is to use ETFs which allow investors to trade the DJIA as a single security, rather than having to buy shares in all 30 constituent companies. A leading example is the SPDR Dow Jones Industrial Average ETF (DIA). DJIA futures contracts enable traders to speculate on the future value of the index and Options provide the right, but not the obligation, to buy or sell the index at a predetermined price in the future. Mutual funds enable investors to buy a share of a diversified portfolio of DJIA stocks thus providing exposure to the overall index.
Recommended Articles


