Dow Jones Industrial Average pulls back after record close
- The Dow Jones slipped back below 43,000 on Tuesday.
- Markets are softer on Tuesday after ripping into new records this week.
- Weak points in tech sector are leading equities lower despite broad earnings beats.
The Dow Jones Industrial Average (DJIA) trimmed lower on Tuesday despite starting the day with a fresh all-time peak bid. The major equity index declined back below the 43,000 major handle through the US market session as chipmakers, health services companies, and the energy sector drag averages lower.
Earnings season is well underway in US equities, with roughly 80% of all reporting companies beating market analyst expectations. However, some dark points are still clouding the skies, with key healthcare and semiconductor producers posting worse-than-expected results in the third quarter.
The economic calendar remains tepid on US data until September’s Retail Sales figures release on Thursday, leaving investors to focus on regular appearances from Federal Reserve (Fed) policymakers that dot the landscape throughout the week. Energy sector stocks broadly eased after the US announced it had secured assurances that Israel won’t be targeting Iranian Crude Oil or nuclear energy facilities as the ongoing Middle East geopolitical conflict roils on.
Dow Jones news
Despite a sharp pullback in key sectors on Tuesday dragging equity indexes lower, most of the Dow Jones listed securities are trading into the green for the day, with losses contained within the bottom third of stocks. Boeing (BA) rebounded 2.3% to trade above $152 per share on Tuesday, recovering from the week’s low below $147.
Unitedhealth Group (UNH) tumbled nearly 7%, backsliding below $565 per share after it revised its full-year earnings outlook lower. Intel (INTC) also swooned on Tuesday, easing over 2% lower and falling below $23 per share in a knock-on bearish slide after Dutch semiconductor producer ASML (ASML) accidentally released its quarterly earnings early. ASML handily beat performance expectations but revealed unexpected weakness in the semiconductor market associated with chipmakers. ASML’s re-tuned forward guidance for 2025 sees a growing soft patch from tech subsectors associated with chipboards and AI tech.
Dow Jones price forecast
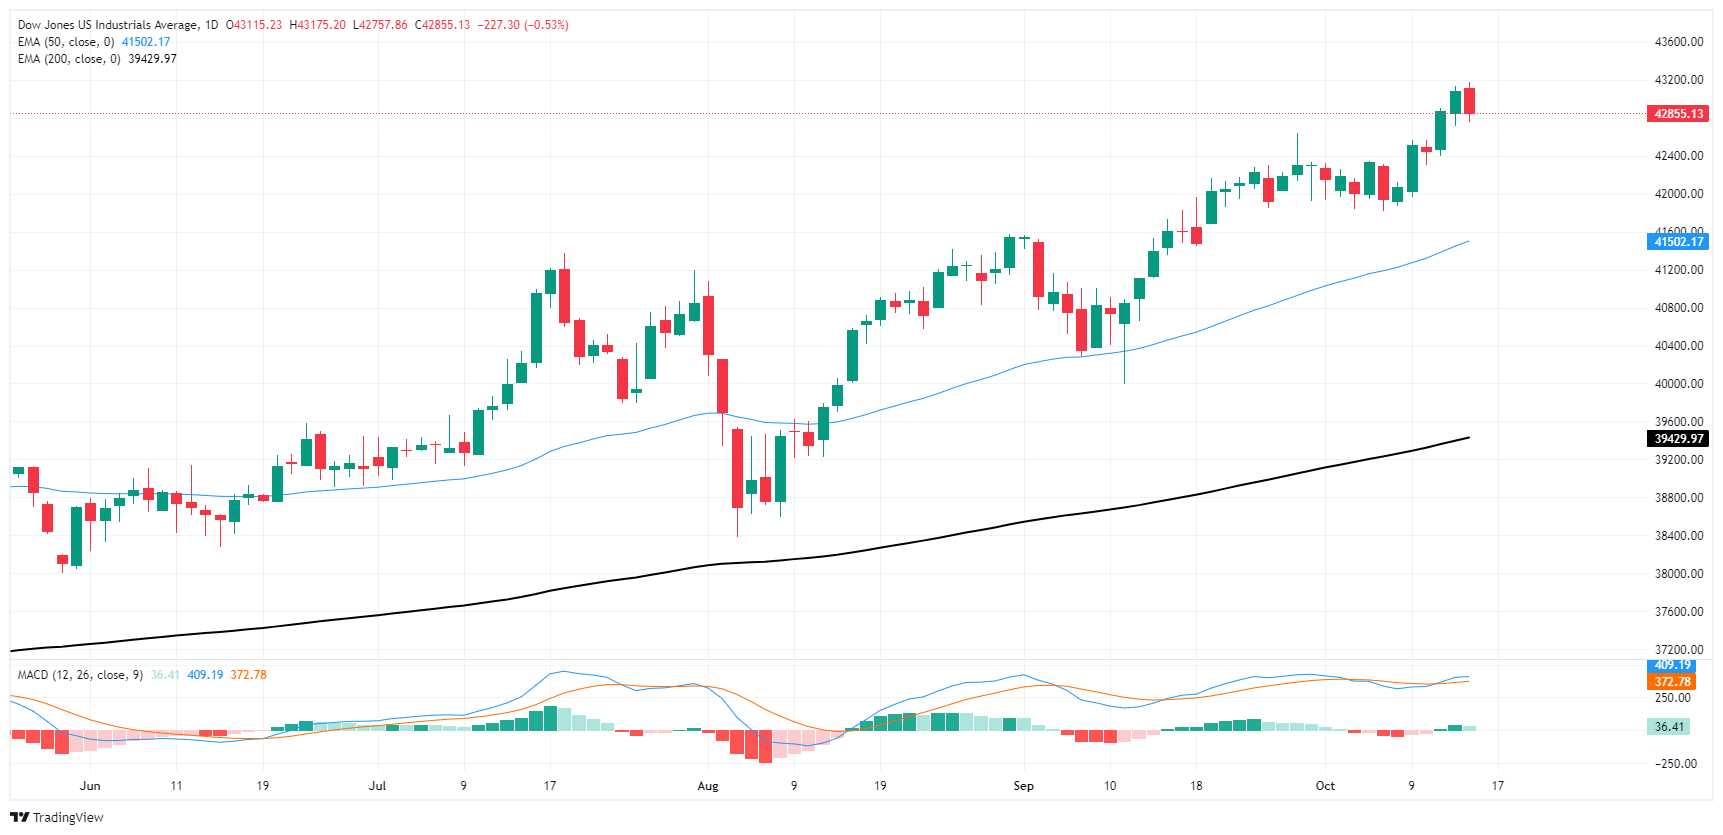
Despite a downturn in Tuesday’s overall bids, the Dow Jones continues to grind out fresh highs on the top side. The major equity index hit a new all-time peak bid early Tuesday of 43,175 before bearish sentiment in key equities dragged the DJIA back below the 43,000 handle.
Despite shedding roughly one-third of a percent on Tuesday, the Dow Jones remains firmly buried in bullish territory. The index is up nearly 15% bottom-to-top for the year, with bulls entirely outrunning the 200-day Exponential Moving Average (EMA) since November of 2023, which is struggling to catch up to current price action as the long-run average grinds north of 39,400.
Dow Jones daily chart
Dow Jones FAQs
The Dow Jones Industrial Average, one of the oldest stock market indices in the world, is compiled of the 30 most traded stocks in the US. The index is price-weighted rather than weighted by capitalization. It is calculated by summing the prices of the constituent stocks and dividing them by a factor, currently 0.152. The index was founded by Charles Dow, who also founded the Wall Street Journal. In later years it has been criticized for not being broadly representative enough because it only tracks 30 conglomerates, unlike broader indices such as the S&P 500.
Many different factors drive the Dow Jones Industrial Average (DJIA). The aggregate performance of the component companies revealed in quarterly company earnings reports is the main one. US and global macroeconomic data also contributes as it impacts on investor sentiment. The level of interest rates, set by the Federal Reserve (Fed), also influences the DJIA as it affects the cost of credit, on which many corporations are heavily reliant. Therefore, inflation can be a major driver as well as other metrics which impact the Fed decisions.
Dow Theory is a method for identifying the primary trend of the stock market developed by Charles Dow. A key step is to compare the direction of the Dow Jones Industrial Average (DJIA) and the Dow Jones Transportation Average (DJTA) and only follow trends where both are moving in the same direction. Volume is a confirmatory criteria. The theory uses elements of peak and trough analysis. Dow’s theory posits three trend phases: accumulation, when smart money starts buying or selling; public participation, when the wider public joins in; and distribution, when the smart money exits.
There are a number of ways to trade the DJIA. One is to use ETFs which allow investors to trade the DJIA as a single security, rather than having to buy shares in all 30 constituent companies. A leading example is the SPDR Dow Jones Industrial Average ETF (DIA). DJIA futures contracts enable traders to speculate on the future value of the index and Options provide the right, but not the obligation, to buy or sell the index at a predetermined price in the future. Mutual funds enable investors to buy a share of a diversified portfolio of DJIA stocks thus providing exposure to the overall index.

