
US Dollar steadies ahead of first clash between Trump and Harris in presidential debate
- The US Dollar trades flat in the European trading session ahead of some lower-tier economic data.
- All eyes are on the first debate between Trump and Harris on Tuesday night in Philadelphia.
- The US Dollar Index halts its rally ahead of testing a vital resistance level.
The US Dollar (USD) is sidetracking on Tuesday, away from being data-driven on riding the US Federal Reserve (Fed) comments for a brief moment. All eyes on Tuesday will be on the clash between former US President Donald Trump and Vice President Kamala Harris in their race for the White House. It will be the first – and possibly the only time – that the two candidates will get to debate each other in an attempt to win more votes as polls suggest that Trump has regained some ground compared to where things stood after the Democratic convention.
On the economic data front, the economic calendar doesn’t offer much market-moving numbers to digest on Tuesday. Even the speech from Federal Reserve Vice Chair for Supervision Michael Barr is not expected to have any impact as the Fed is already within its blackout period ahead of the Federal Open Market Committee (FOMC) gathering on September 17 and 18. It looks like markets will have a dull day ahead if no comments or major headlines emerge.
Daily digest market movers: Yawn
- The NFIB Business Optimism Index for August came in at 91.2, below the 93.6 expected and down from 93.7 previously.
- The Organization of the Petroleum Exporting Countries (OPEC) is set to release its monthly Oil Market Report at around 12:00 GMT.
- Federal Reserve Vice Chair for Supervision Michael Barr speaks at a Brookings Institution event in Washington about the Basel III Endgame regulatory framework. Barr isn't expected to talk about monetary policy because the Fed is within its blackout period ahead of its meeting on September 17-18.
- The US Treasury is set to distribute a 3-year note around 17:00 GMT.
- Equities trade mixed after US indices were able to close off Monday on a positive note. Some small profit-taking is taking place in Europe and in US futures during the European trading hours.
- The CME Fedwatch Tool shows a 73.0% chance of a 25 basis points (bps) interest rate cut by the Fed on September 18 against a 27.0% chance for a 50 bps cut. For the meeting on November 7, another 25 bps cut (if September is a 25 bps cut) is expected in November by 31.9%, while there is a 52.9% chance that rates will be 75 bps (25 bps + 50 bps) and a 15.2% probability of rates being 100 (25 bps + 75 bps) basis points lower.
- The US 10-year benchmark rate trades at 3.71%, off the low from Monday, when T-notes hit 3.69%.
US Dollar Index Technical Analysis: Range trading
The US Dollar Index (DXY) is letting loose this Tuesday after its rally on Monday, when the DXY was able to cross to the higher level of the range it has been trading since mid-August. The light data calendar makes the US Dollar range trade for now, awaiting either more clear data to confirm what kind of interest-rate cut markets will get next week from the Fed or any geopolitical catalysts
The first resistance at 101.90 is getting ready for a second test after its rejection last week. Further up, a steep 2% uprising would be needed to get the index to 103.18. The next tranche up is a very misty one, with the 55-day Simple Moving Average (SMA) at 103.40, followed by the 200-day SMA at 103.89, just ahead of the big 104.00 round level.
On the downside, 100.62 (the low from December 28) holds strong and has already made the DXY rebound four times in recent weeks. Should it break, the low from July 14, 2023, at 99.58, will be the ultimate level to look out for. Once that level gives way, early levels from 2023 are coming in near 97.73.
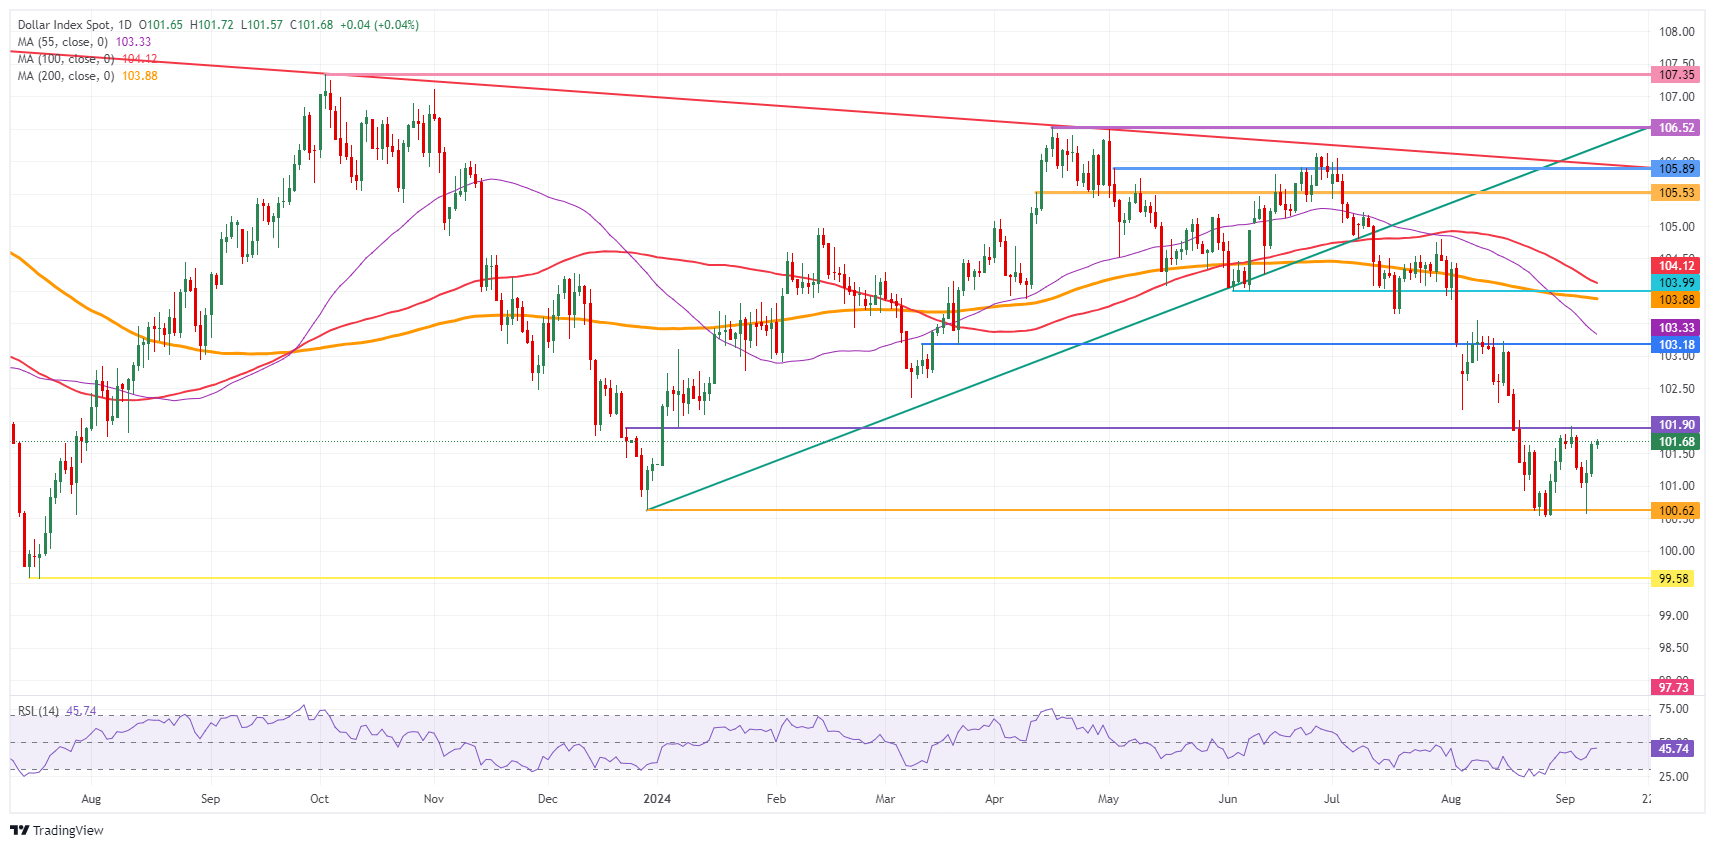
US Dollar Index: Daily Chart
US Dollar FAQs
The US Dollar (USD) is the official currency of the United States of America, and the ‘de facto’ currency of a significant number of other countries where it is found in circulation alongside local notes. It is the most heavily traded currency in the world, accounting for over 88% of all global foreign exchange turnover, or an average of $6.6 trillion in transactions per day, according to data from 2022. Following the second world war, the USD took over from the British Pound as the world’s reserve currency. For most of its history, the US Dollar was backed by Gold, until the Bretton Woods Agreement in 1971 when the Gold Standard went away.
The most important single factor impacting on the value of the US Dollar is monetary policy, which is shaped by the Federal Reserve (Fed). The Fed has two mandates: to achieve price stability (control inflation) and foster full employment. Its primary tool to achieve these two goals is by adjusting interest rates. When prices are rising too quickly and inflation is above the Fed’s 2% target, the Fed will raise rates, which helps the USD value. When inflation falls below 2% or the Unemployment Rate is too high, the Fed may lower interest rates, which weighs on the Greenback.
In extreme situations, the Federal Reserve can also print more Dollars and enact quantitative easing (QE). QE is the process by which the Fed substantially increases the flow of credit in a stuck financial system. It is a non-standard policy measure used when credit has dried up because banks will not lend to each other (out of the fear of counterparty default). It is a last resort when simply lowering interest rates is unlikely to achieve the necessary result. It was the Fed’s weapon of choice to combat the credit crunch that occurred during the Great Financial Crisis in 2008. It involves the Fed printing more Dollars and using them to buy US government bonds predominantly from financial institutions. QE usually leads to a weaker US Dollar.
Quantitative tightening (QT) is the reverse process whereby the Federal Reserve stops buying bonds from financial institutions and does not reinvest the principal from the bonds it holds maturing in new purchases. It is usually positive for the US Dollar.
Recommended Articles


