

US Dollar stronger with rising concerns on Trump’s plans
- The US Dollar sets the record straight on Tuesday, extending Monday’s gains.
- The bond market is signalling issues ahead with Trump’s spending plans.
- The US Dollar index pops above 106.00 and flirts with another break higher.
The US Dollar (USD) gains strength on Tuesday, with the bond market fretting over former US President Donald Trump’s spending plans. The possibility of Trump being reelected as President gained a lot after the US Supreme Court ruling confirmed on Monday that Trump has partial immunity in the court cases on the riots that ended in a breach at the US Congress. With the recent spending plans revealed by the former President, the bond market is worried about where the money will come from while local market conditions could turn into higher inflation again.
On the US economic front, the calendar is relatively light in terms of data. However, from a speaker's point of view, the big guns are out. European Central Bank (ECB) President Christine Lagarde and the US Federal Reserve (Fed) Chairman Jerome Powell will take the stage at the Sintra ECB symposium.
Daily digest market movers: Sintra Portugal a place to be
- At 13:30 GMT, Fed Chairman Jerome Powell and ECB President Christine Lagarde will participate in a panel about monetary policy at the ECB Forum on Central Banking in Sintra, Portugal.
- The JOLTS Job Openings figure for May will be released at 14:00 GMT. A slide towards 7.9 million is expected from the previous count of 8.059 million.
- Equities are cracking a bit under pressure on the back of the reaction in the bond market after Trump’s legal victory. Both European and US equities are in the red ahead of the US session.
- The CME Fedwatch Tool is broadly backing a rate cut in September despite recent comments from Fed officials. The odds now stand at 59.9% for a 25-basis-point cut. A rate pause stands at a 34.7% chance, while a 50-basis-point rate cut has a slim 5.4% possibility.
- The US 10-year benchmark rate trades near 4.45% and prints a new high for the week.
US Dollar Index Technical Analysis: Greenback hits the panic button
The US Dollar Index (DXY) is gaining on the back of some risk-off sentiment that entered the markets late Monday. The change of heart came after the US Supreme Court ruling that fell partially in favor of former US President Donald Trump. With the DXY now gaining more momentum, the threat grows by the day the Japanese government might intervene to safeguard the Japanese Yen (JPY).
On the upside, the pivotal level of 105.89 is being regained, which is a must have for additional gains. Once a daily close has taken place above that level, marching above the red descending trend line in the chart below at 106.26 and the peak of April at 106.52 are the two main resistances ahead of a fresh nine-month high. That would be reached once 107.35 is being broken to the upside.
On the downside, 105.53 is the first support ahead of a trifecta of Simple Moving Averages (SMA). Next down is the 55-day SMA at 105.25, safeguarding the 105.00 round figure. A touch lower, near 104.75 and 104.46, both the 100-day and the 200-day SMA form a double layer of protection to support any declines together with the green ascending trendline from last December.
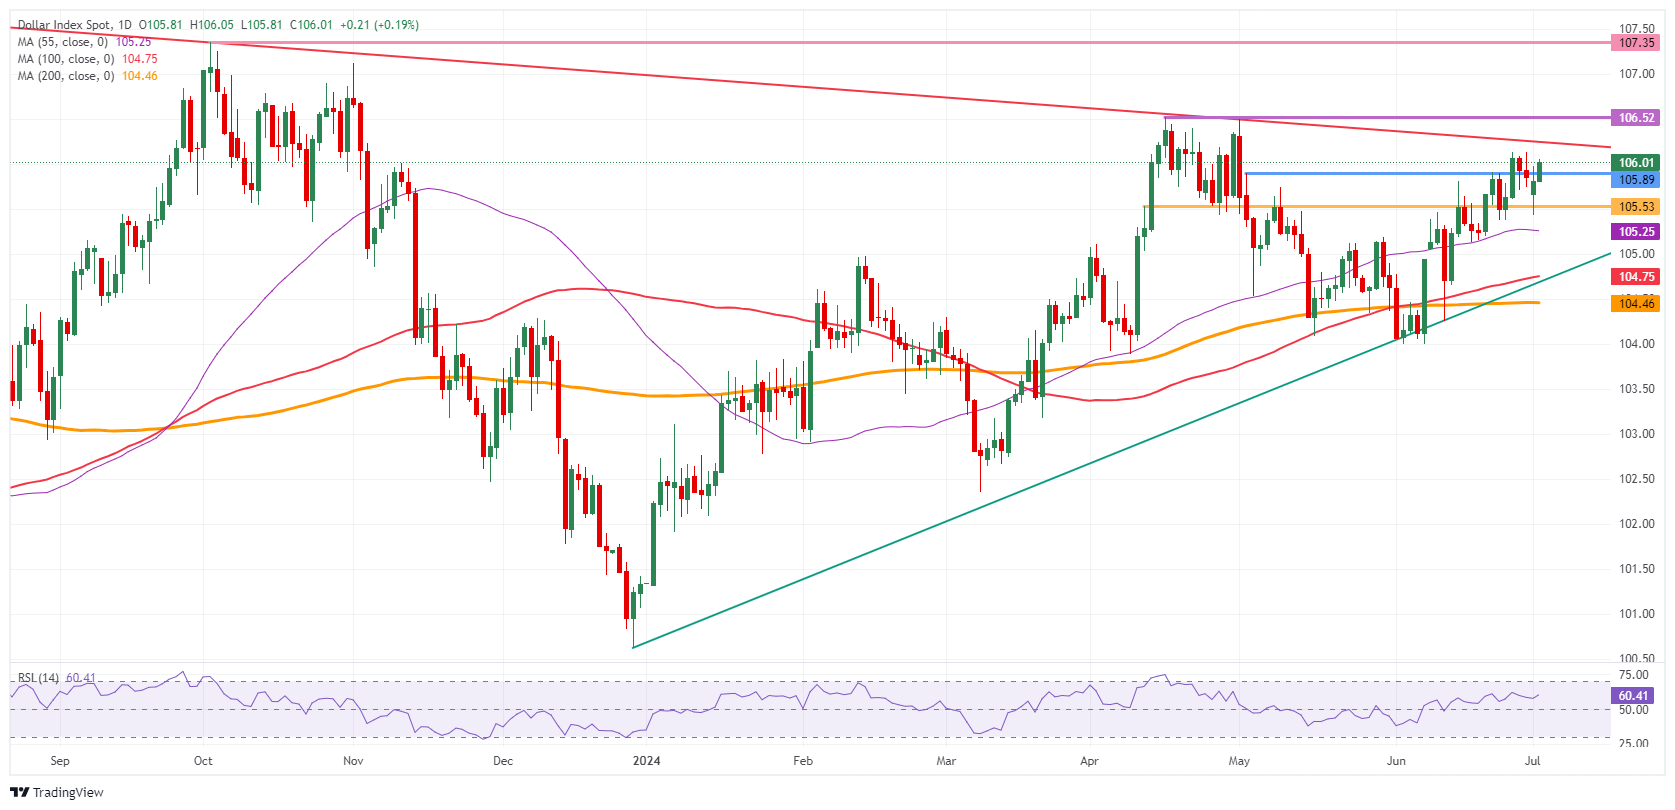
US Dollar Index: Daily Chart
US Dollar FAQs
The US Dollar (USD) is the official currency of the United States of America, and the ‘de facto’ currency of a significant number of other countries where it is found in circulation alongside local notes. It is the most heavily traded currency in the world, accounting for over 88% of all global foreign exchange turnover, or an average of $6.6 trillion in transactions per day, according to data from 2022. Following the second world war, the USD took over from the British Pound as the world’s reserve currency. For most of its history, the US Dollar was backed by Gold, until the Bretton Woods Agreement in 1971 when the Gold Standard went away.
The most important single factor impacting on the value of the US Dollar is monetary policy, which is shaped by the Federal Reserve (Fed). The Fed has two mandates: to achieve price stability (control inflation) and foster full employment. Its primary tool to achieve these two goals is by adjusting interest rates. When prices are rising too quickly and inflation is above the Fed’s 2% target, the Fed will raise rates, which helps the USD value. When inflation falls below 2% or the Unemployment Rate is too high, the Fed may lower interest rates, which weighs on the Greenback.
In extreme situations, the Federal Reserve can also print more Dollars and enact quantitative easing (QE). QE is the process by which the Fed substantially increases the flow of credit in a stuck financial system. It is a non-standard policy measure used when credit has dried up because banks will not lend to each other (out of the fear of counterparty default). It is a last resort when simply lowering interest rates is unlikely to achieve the necessary result. It was the Fed’s weapon of choice to combat the credit crunch that occurred during the Great Financial Crisis in 2008. It involves the Fed printing more Dollars and using them to buy US government bonds predominantly from financial institutions. QE usually leads to a weaker US Dollar.
Quantitative tightening (QT) is the reverse process whereby the Federal Reserve stops buying bonds from financial institutions and does not reinvest the principal from the bonds it holds maturing in new purchases. It is usually positive for the US Dollar.
Recommended Articles


