
US Dollar softer after Le Pen wins first round with a caveat
- The US Dollar eases at the start of the first week of July.
- A very full US economic calendar ahead, with the US Jobs Report as dessert.
- The US Dollar index retreats to the mid-105.00 level.
The US Dollar (USD) sees the Euro outpacing everyone on Monday after the first round of the French government elections took place. A clear victory for Marine Le Pen and her far-right party Rassemblement National (RN), though a stalemate could be at hand. None of the three major parties – Marine Le Pen’s far-right Rassemblement National, Emmanuel Macron’s centric Ensemble Citoyens, and Jean-Luc Mélenchon’s far-left Nouveau Front Populaire – have reached their projected results as of the latest polls. Both the far left and the far right parties have reached less positive results, as the latest polls on Friday suggested, while Macron’s party was able to salvage the situation a bit, though still coming in third, which means no one holds a majority and a stalemate could be at hand.
On the US economic calendar front, US traders will have little time to digest the French election news, with already some nice data points ahead on Monday as the Institute for Supply Management is gearing up for its June numbers on Manufacturing. Additionally, the European Central Bank (ECB) is holding its European Jackson Hole version, with its annual symposium in Sintra, Portugal, with many comments and interviews expected from several central bank members from across the globe.
Daily digest market movers: US off to an early start
- The annual three-day European Central Bank Symposium starts in Sintra, Portugal, and lasts until Wednesday. ECB president Christine Lagarde will deliver a speech and opening remarks. More headlines are expected throughout these three days, with several central bank members and policymakers to be interviewed and making comments.
- At 13:45 GMT, S&P Global will release June’s Purchasing Managers Index (PMI) for the Manufacturing sector’s final reading. The previous reading was 51.7, and no changes are expected.
- At 14:00 GMT, the Institute for Supply Management will release June’s PMI Index:
- Manufacturing PMI is seen heading to 49 from 48.7.
- The New Orders Index was at 45.4 in May, with no forecast available for June.
- The Employment Index was previously at 51.1, with no consensus view available.
- The Prices Paid Index is seen declining to 55.9 from 57.
- Equities are roaring and rallying higher with this French election gridlock result going into next week’s voting. Certainly, in Europe, all indices are popping higher by over 1%, while US equity futures are enjoying the positive spillover effect.
- The CME Fedwatch Tool is broadly backing a rate cut in September despite recent comments from Federal Reserve (Fed) officials. The odds now stand at 57.8% for a 25-basis-point cut. A rate pause stands at a 35.7% chance, while a 50-basis-point rate cut has a slim 6.5% possibility.
- The US 10-year benchmark rate trades near 4.39% and slid lower from its opening at 4.42% on the back of the French election news.
US Dollar Index Technical Analysis: If BoJ strikes now…
The US Dollar Index (DXY) is facing headwinds from its biggest contributor in the Index, the Euro, which accounts for 57.6% of the total package. The appreciation of the Euro is pushing the Greenback in the fences already on early Monday trading. With the sword of Damocles still hanging over the US Dollar, from possible intervention from the Ministry of Finance from Japan, the DXY could be gearing up for one of its biggest corrections for this year.
On the upside, the pivotal level of 105.89 must be regained first. The DXY failed to stay above that level last week. Once above there, marching above the red descending trend line in the chart below at 106.26 and the peak of April at 106.52 are the two main resistances ahead of a fresh nine-month high. That would be reached once 107.35 is being broken to the upside.
On the downside, 105.53 is the first support ahead of a trifecta of Simple Moving Averages (SMA). Next down is the 55-day SMA at 105.25, safeguarding the 105.00 round figure. A touch lower, near 104.73 and 104.45, both the 100-day and the 200-day SMA form a double layer of protection to support any declines together with the green ascending trendline from last December.
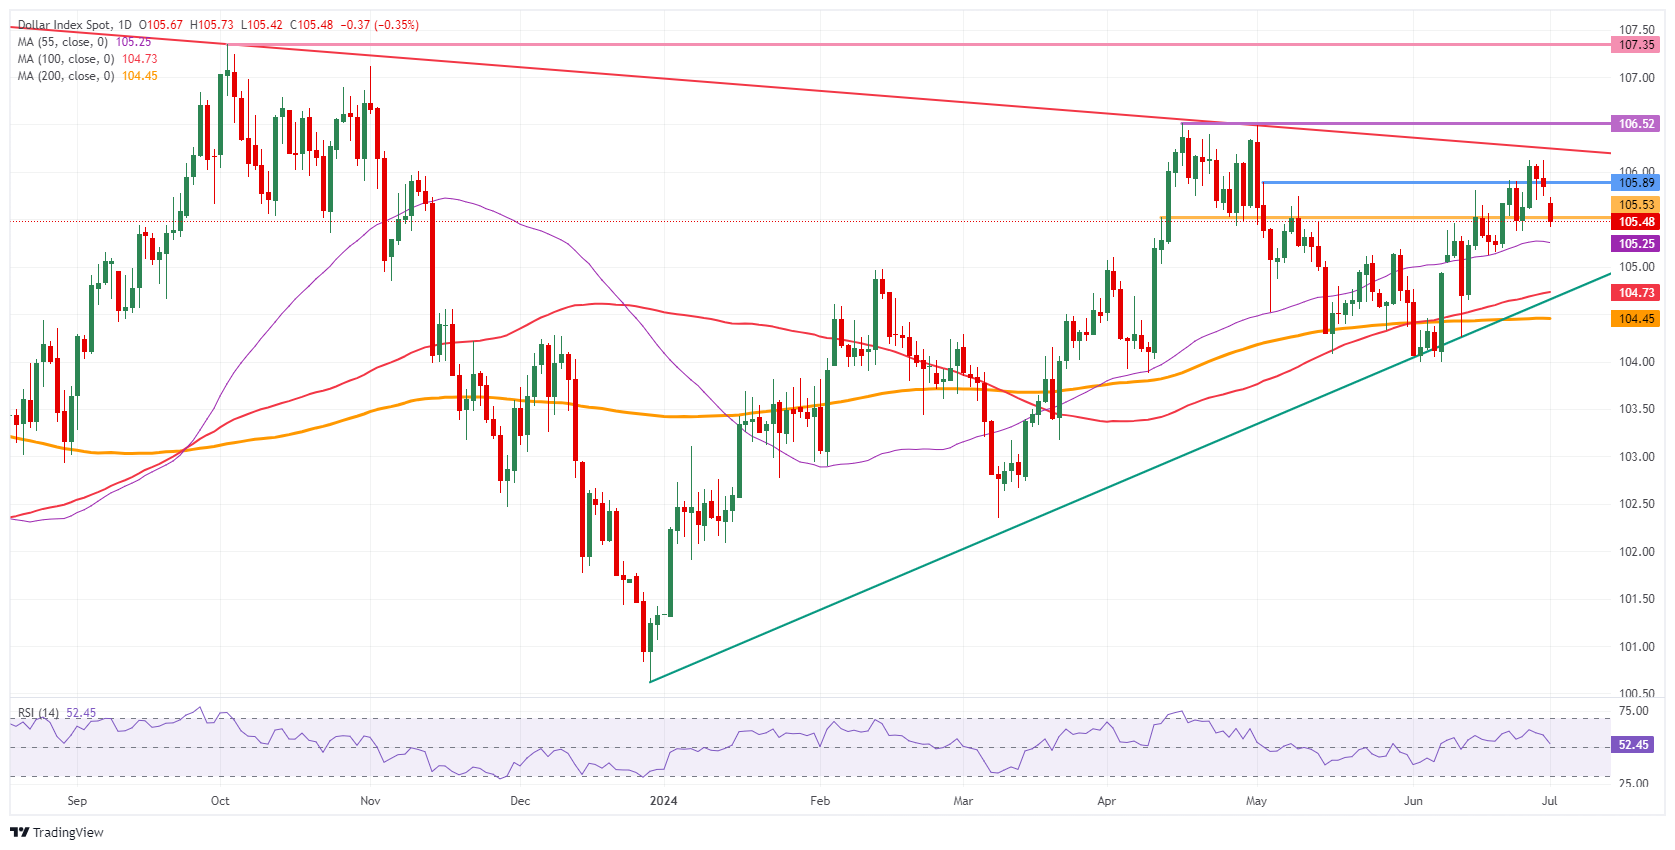
US Dollar Index: Daily Chart
US Dollar FAQs
The US Dollar (USD) is the official currency of the United States of America, and the ‘de facto’ currency of a significant number of other countries where it is found in circulation alongside local notes. It is the most heavily traded currency in the world, accounting for over 88% of all global foreign exchange turnover, or an average of $6.6 trillion in transactions per day, according to data from 2022. Following the second world war, the USD took over from the British Pound as the world’s reserve currency. For most of its history, the US Dollar was backed by Gold, until the Bretton Woods Agreement in 1971 when the Gold Standard went away.
The most important single factor impacting on the value of the US Dollar is monetary policy, which is shaped by the Federal Reserve (Fed). The Fed has two mandates: to achieve price stability (control inflation) and foster full employment. Its primary tool to achieve these two goals is by adjusting interest rates. When prices are rising too quickly and inflation is above the Fed’s 2% target, the Fed will raise rates, which helps the USD value. When inflation falls below 2% or the Unemployment Rate is too high, the Fed may lower interest rates, which weighs on the Greenback.
In extreme situations, the Federal Reserve can also print more Dollars and enact quantitative easing (QE). QE is the process by which the Fed substantially increases the flow of credit in a stuck financial system. It is a non-standard policy measure used when credit has dried up because banks will not lend to each other (out of the fear of counterparty default). It is a last resort when simply lowering interest rates is unlikely to achieve the necessary result. It was the Fed’s weapon of choice to combat the credit crunch that occurred during the Great Financial Crisis in 2008. It involves the Fed printing more Dollars and using them to buy US government bonds predominantly from financial institutions. QE usually leads to a weaker US Dollar.
Quantitative tightening (QT) is the reverse process whereby the Federal Reserve stops buying bonds from financial institutions and does not reinvest the principal from the bonds it holds maturing in new purchases. It is usually positive for the US Dollar.
Recommended Articles


